Copyright
©The Author(s) 2017.
World J Gastroenterol. Oct 7, 2017; 23(37): 6833-6844
Published online Oct 7, 2017. doi: 10.3748/wjg.v23.i37.6833
Published online Oct 7, 2017. doi: 10.3748/wjg.v23.i37.6833
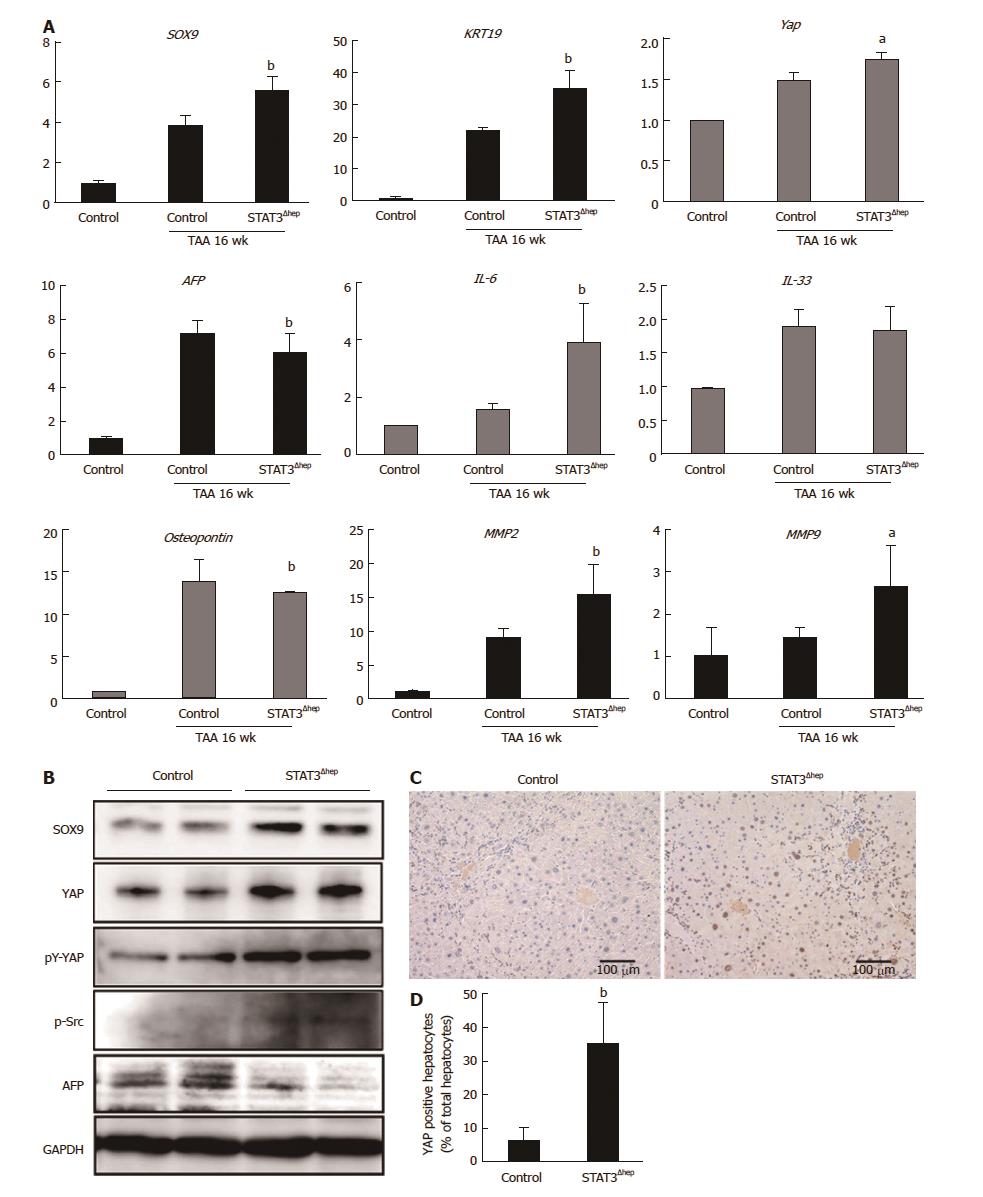
Figure 5 YAP activation in STAT3-deficient hepatocyte with thioacetamide treatment.
A: Quantitative real-time RT-PCR analysis for SOX-9, KRT 19, YAP, AFP, IL-6, IL-33, Osteopontin, MMP2, and MMP9 mRNA expression levels. The relative expression of each gene mRNA was normalized to GAPDH mRNA (n = 6). aP < 0.05 (YAP; P = 0.0134, AFP; P = 0.00347, MMP9; P = 0.00271) and bP < 0.01 (SOX9; P = 0.00274, KRT19; P = 0.00402, IL-6; P = 0.00147, MMP2; P = 0.00404) vs control (TAA treatment for 16 wk). B: Immunoblotting analysis for SOX-9, YAP, pY-YAP, p-Src and AFP protein expression levels. GAPDH served as loading control. C: Representative immunohistochemical staining for YAP in livers of control and STAT3Δhep mice with TAA treatment for 16 wk. Nuclear YAP was augmented in STAT3Δhep hepatocytes with TAA treatment for 16 wk. Original magnification × 200. D: The number of nuclear YAP positive hepatocytes. Ratio of nuclear YAP positive hepatocytes to all hepatocytes was quantified in three different samples per a group. Values represent means ± SE of the mean. bP < 0.01 (P = 0.00312) vs control. TAA: Thioacetamide.
- Citation: Abe M, Yoshida T, Akiba J, Ikezono Y, Wada F, Masuda A, Sakaue T, Tanaka T, Iwamoto H, Nakamura T, Sata M, Koga H, Yoshimura A, Torimura T. STAT3 deficiency prevents hepatocarcinogenesis and promotes biliary proliferation in thioacetamide-induced liver injury. World J Gastroenterol 2017; 23(37): 6833-6844
- URL: https://www.wjgnet.com/1007-9327/full/v23/i37/6833.htm
- DOI: https://dx.doi.org/10.3748/wjg.v23.i37.6833


