Copyright
©The Author(s) 2017.
World J Gastroenterol. May 7, 2017; 23(17): 3111-3121
Published online May 7, 2017. doi: 10.3748/wjg.v23.i17.3111
Published online May 7, 2017. doi: 10.3748/wjg.v23.i17.3111
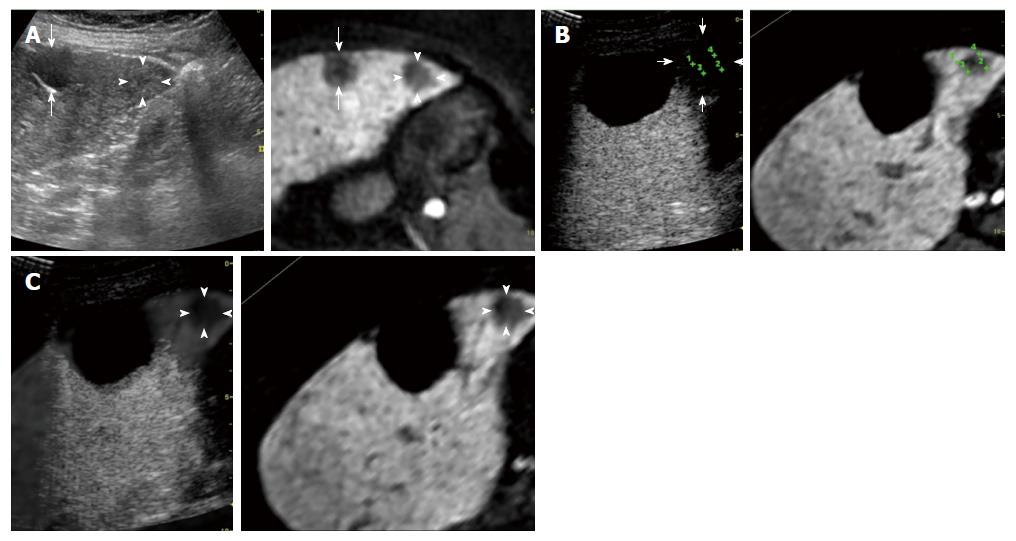
Figure 1 A 70-year-old woman with an early hepatocellular carcinoma lesion (maximum diameter, 18 mm) in segment V of the liver.
A: A fusion image combining conventional ultrasonography (US) (left side) and the hepatobiliary phase of contrast-enhanced magnetic resonance imaging (MRI) with Gd-EOB-DTPA (right side) shows the targeted early hepatocellular carcinoma (HCC) lesion (arrowheads), which appears as an unclear slightly hyper-echoic lesion on conventional US and as a hypo-intense area on the hepatobiliary phase. The arrows indicate the margin of the liver cyst; B: Transcostal fusion imaging, obtained 1 d after radiofrequency ablation (RFA), combining the portal phase of contrast-enhanced US (left side) and the hepatobiliary phase of contrast-enhanced MRI with Gd-EOB-DTPA obtained before RFA (right side) with GPS marks on a single screen. These GPS marks appeared within the ablated areas (arrow), appearing as unenhanced areas on the contrast-enhanced US images. The ablation of the lesion was evaluated as being adequate because of the readily apparent ablative margin; C: Transcostal fusion imaging, obtained 1 d after RFA, combining an overlay of a hepatobiliary phase of contrast-enhanced MRI with Gd-EOB-DTPA on a portal phase of contrast-enhanced US image (left side) and a hepatobiliary phase of contrast-enhanced MRI with Gd-EOB-DTPA obtained before RFA (right side). The edge between the ablated HCC and the ablated adjacent liver parenchyma (arrowheads) is easy to identify with an overlay image.
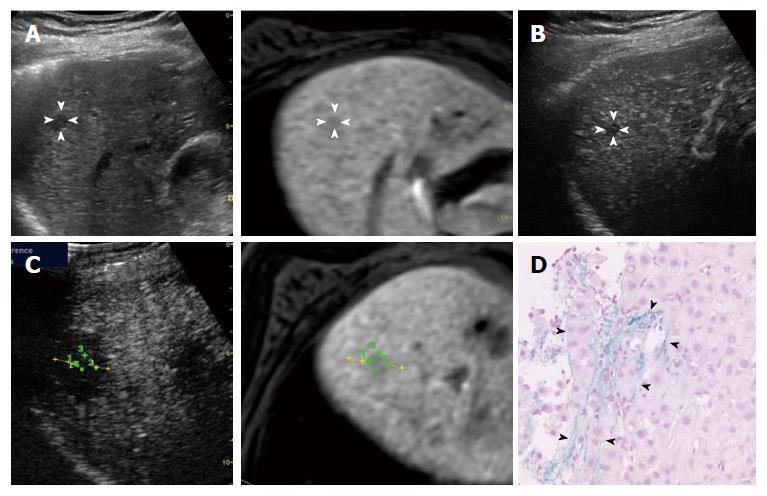
Figure 2 A 78-year-old man with an early hepatocellular carcinoma lesion (maximum diameter, 11 mm) in segment VIII of the liver.
A: The fusion image combining conventional ultrasonography (US) (left side) and the hepatobiliary phase of contrast-enhanced magnetic resonance imaging (MRI) with Gd-EOB-DTPA (right side) shows the targeted early hepatocellular carcinoma (HCC) lesion (arrowheads), which appears as a hypo-echoic lesion on conventional US and as a slightly hypo-intense area during the hepatobiliary phase; B: A contrast-enhanced US image obtained during the arterial phase shows a hypo-vascular lesion (arrowheads); C: Transcostal fusion imaging, obtained 1 d after radiofrequency ablation (RFA), combining a portal phase of contrast-enhanced US (left side) and a hepatobiliary phase of contrast-enhanced MRI with Gd-EOB-DTPA obtained before RFA as a reference (right side) on a single screen. When evaluated using only contrast-enhanced US, the edge between the ablated HCC and the ablated adjacent liver parenchyma is difficult to identify. Using fusion imaging with GPS marks, we confirmed the edge of the ablated HCC clearly on a portal phase of contrast-enhanced US, and the ablative margin was able to be measured as 5.3 mm (yellow dotted line); D: Victoria blue staining, showing elastic fibers surrounding the portal tract in blue, reveals stromal (portal tract) invasion compatible with a diagnosis of early HCC. The arrowheads indicate the portal tract, and cancer cells are present within the portal tract.
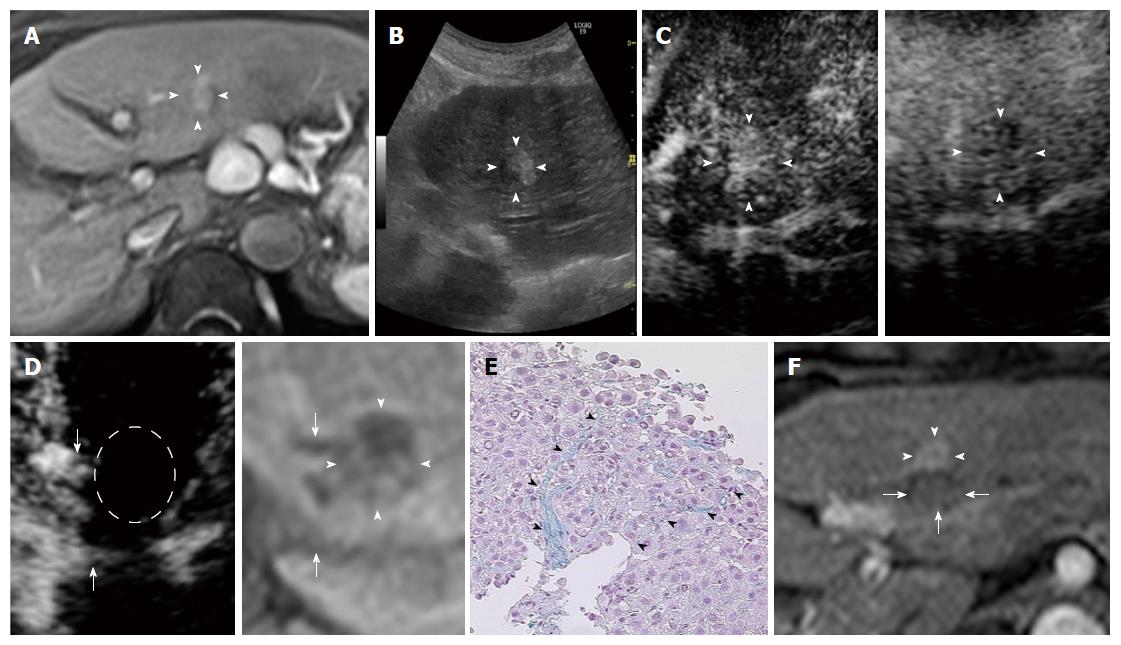
Figure 3 A 74-year-old man with an early hepatocellular carcinoma lesion (maximum diameter, 20 mm) in segment III of the liver.
A: Pretreatment contrast-enhanced magnetic resonance imaging (MRI) with Gd-EOB-DTPA obtained during the arterial phase shows the tumor (arrowheads), with the tumor appearing as a partially hyper-intense area; B: Conventional ultrasonography (US) shows the tumor as an almost hyper-echoic and a partially hypo-echoic lesion (arrowheads); C: Contrast-enhanced US image obtained during the arterial phase (left side) shows the enhancement of almost the entire tumor (arrowheads). The contrast-enhanced US image obtained during the post-vascular phase (right) shows a partially hypo-echoic lesion (arrowheads); D: Contrast-enhanced US obtained during the arterial phase 1 d after radiofrequency ablation (RFA) shows the ablated lesion as an avascular area, and the dotted-line circle shows the site of the tumor (left side). A contrast-enhanced MRI image with Gd-EOB-DTPA obtained during the hepatobiliary phase before RFA is shown as a reference (right side). The ablative margin was evaluated as less than 5 mm because the portal vein was near (arrows); E: Victoria blue staining, showing elastic fibers surrounding the portal tract in blue, reveals stromal (portal tract) invasion compatible with a diagnosis of early hepatocellular carcinoma (arrowheads); F: Post-treatment contrast-enhanced MRI with Gd-EOB-DTPA shows local tumor progression at 636 d after ablation. The arrows indicate the ablative zone, and the arrowheads indicate the recurrence of the tumor, which appeared as a hyper-intense area during the arterial-phase. HCC: Hepatocellular carcinoma.
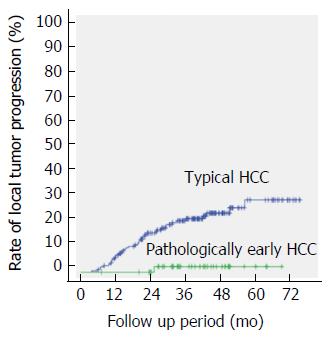
Figure 4 Curves for local tumor progression, as calculated using the Kaplan-Meier method, for pathologically early hepatocellular carcinoma and typical hepatocellular carcinoma.
The graph shows the log-rank test results, indicating that pathologically early HCC was associated with a significantly lower rate of local tumor progression, compared with typical HCC (P = 0.002). HCC: Hepatocellular carcinoma.
- Citation: Hao Y, Numata K, Ishii T, Fukuda H, Maeda S, Nakano M, Tanaka K. Rate of local tumor progression following radiofrequency ablation of pathologically early hepatocellular carcinoma. World J Gastroenterol 2017; 23(17): 3111-3121
- URL: https://www.wjgnet.com/1007-9327/full/v23/i17/3111.htm
- DOI: https://dx.doi.org/10.3748/wjg.v23.i17.3111


