Copyright
©The Author(s) 2017.
World J Gastroenterol. Apr 28, 2017; 23(16): 2899-2911
Published online Apr 28, 2017. doi: 10.3748/wjg.v23.i16.2899
Published online Apr 28, 2017. doi: 10.3748/wjg.v23.i16.2899
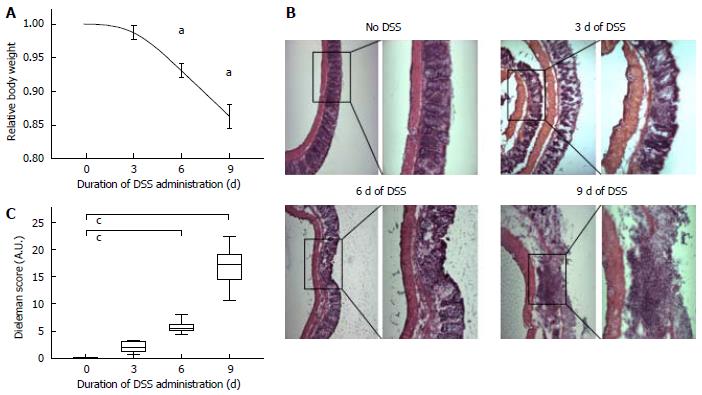
Figure 1 Assessment of dextran sodium-sulfate-incuded colitis by evaluation of relative body weight loss and histological damage.
C57BL/6 WT mice received 3% DSS in their drinking water for 3, 6 or 9 d, respectively. Inflammation was monitored by daily measurement of individual body weights. A: Development of relative body weight after 3, 6 and 9 d of treatment with DSS. Control group received tap water only. Data are mean ± SD; n = 10 for each group, aP < 0.01; B: Representative HE-stained histologic images of resected colons showing increasing inflammatory infiltrates (left panels, magnification × 10; right panels, magnification × 20); C: Histologic Dieleman Score (range from 0-40 points) describing inflammation, depth of inflammation and crypt damage or regeneration. Boxplot with median and whiskers, n = 10 for each group, cP < 0.01. DSS: Dextran sodium-sulfate.
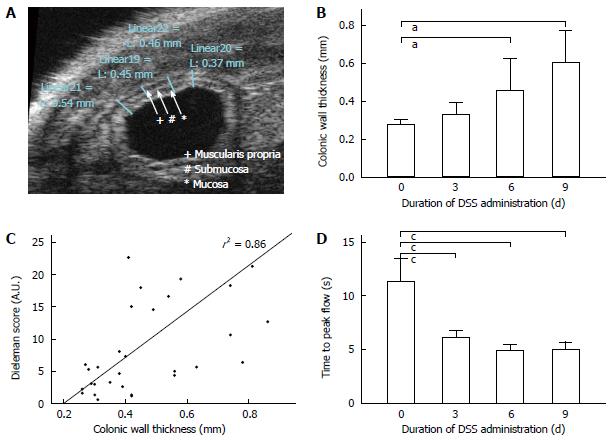
Figure 2 Contrast-enhanced ultrasound accurately detects dextran sodium-sulfate-induced colitis.
A: Native ultrasound of the murine colon visualizing the bowel wall stratification. Thickness of the wall was measured in triplicate. Colon filled with ultrasound contact gel for improved testing conditions; B: Colonic wall thicknesses correlate with exposure to DSS in a time-dependent manner. DSS treatment led to a loss of sonographic bowel wall stratification (not shown). Data are means ± SD, n =10 for each group, aP < 0.05; C: Linear regression between parameters thickness of colon wall and histological Dieleman score shows a significant correlation as indicated by determination coefficient r2 = 0.86; D: Time to peak flow depicting start of contrast agent application until maximal pixel contrast intensity in seconds. Time to peak flow correlates with exposure to DSS in a time-dependent manner. Data are mean ± SD, n = 10 for each group, cP < 0.01.
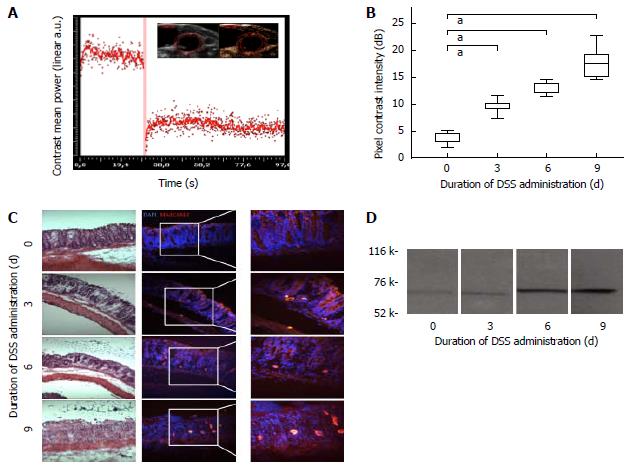
Figure 3 mucosal addressin cellular adhesion molecule-1-targeted contrast enhanced ultrasound reflects experimental intestinal inflammation.
A: Schematic illustration of a destruction-replenishment sequence with ultrasound pulses of high acoustic power (red bar) and reperfusion of contrast agent for acquisition of highly specific molecularly targeted CEUS. Image insert showing B mode image (left) and corresponding CEUS image (right); B: CEUS with targeted contrast agent against MAdCAM-1. Contrast mean power of defined ROI in descending colon in arbitrary unit dB. Decibel values correlate with exposure to DSS in a time-dependent manner. Boxplot with median and whiskers, n = 10 for each group, aP < 0.05; C: Immunofluorescence with staining against MAdCAM-1 (bright red), cell nuclei counterstained with DAPI (blue). Positively stained cells were counted in at least 10 representative high power fields per section and cell numbers were expressed semi-quantitatively. Left panel: corresponding HE stained sections; D: Immunoblot with purified anti-mouse MAdCAM-1 antibody showing a characteristic protein band at 58-66kDa. Animals exposed to DSS for 6 and 9 d showing stronger expression of MAdCAM-1 than control animals. DSS: Dextran sodium-sulfate; CEUS: Contrast-enhanced ultrasound; MAdCAM-1: Mucosal addressin cellular adhesion molecule-1.
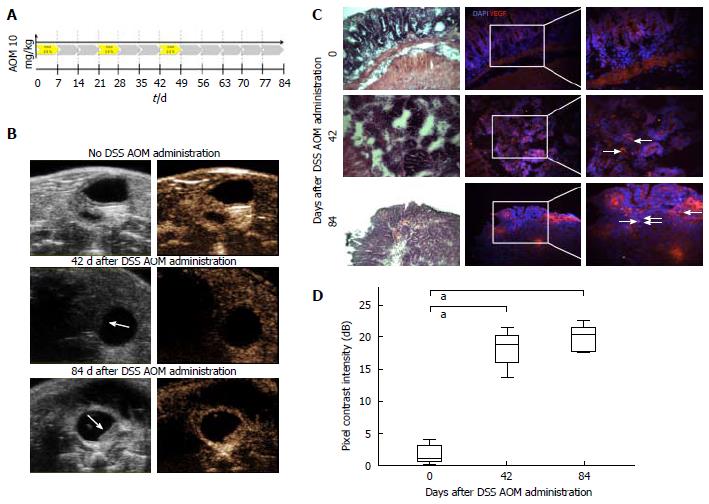
Figure 4 Evaluation of vascular endothelial growth factor expression in colorectal carcinogenesis by contrast-enhanced ultrasound.
A: Schematic illustration of induction of dextran sodium-sulfate (DSS)/azoxymethane (AOM) colitis. Single intraperitoneal AOM application followed by three cycles of 2.5% (w/v) DSS in drinking water (days 0 to 7, days 21 to 28 and days 42 to 49); B: Schematic illustration of contrast agent ultrasound in highly specific molecularly VEGF-targeted CEUS. Development of tumors after 42 and 84 d after treatment with AOM. White arrows depicting colonic tumor mass. Left panel, B mode images; right panel, corresponding CEUS images; C: Immunhistochemistry staining against VEGF (bright red), cell nuclei were counterstained with DAPI (blue). Positively stained cells were counted in at least 10 representative high power fields per section and cell numbers were expressed semi-quantitatively; D: CEUS with targeted contrast agent against VEGF. Contrast mean power of defined ROI in descending colon in arbitrary unit dB. Decibel values correlate with exposure to DSS in a time-dependent manner. Boxplot with median and whiskers, n = 10 for each group, aP < 0.01. VEGF: Vascular endothelial growth factor; DSS: Dextran sodium-sulfate; CEUS: Contrast-enhanced ultrasound; AOM: Azoxymethane.
- Citation: Brückner M, Heidemann J, Nowacki TM, Cordes F, Stypmann J, Lenz P, Gohar F, Lügering A, Bettenworth D. Detection and characterization of murine colitis and carcinogenesis by molecularly targeted contrast-enhanced ultrasound. World J Gastroenterol 2017; 23(16): 2899-2911
- URL: https://www.wjgnet.com/1007-9327/full/v23/i16/2899.htm
- DOI: https://dx.doi.org/10.3748/wjg.v23.i16.2899


