Copyright
©The Author(s) 2017.
World J Gastroenterol. Apr 28, 2017; 23(16): 2899-2911
Published online Apr 28, 2017. doi: 10.3748/wjg.v23.i16.2899
Published online Apr 28, 2017. doi: 10.3748/wjg.v23.i16.2899
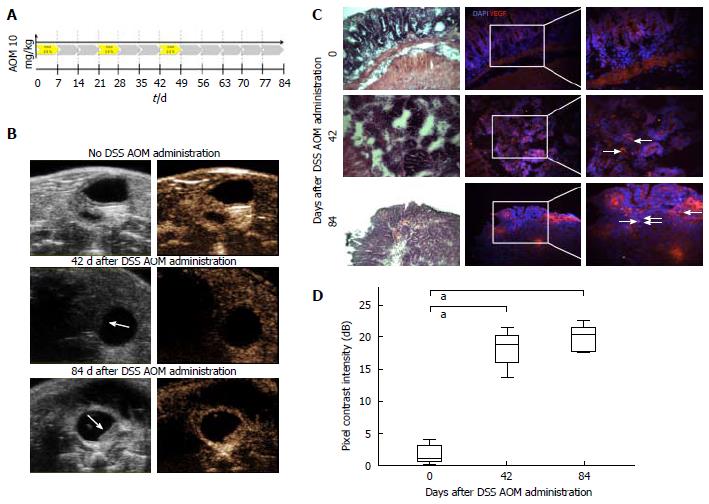
Figure 4 Evaluation of vascular endothelial growth factor expression in colorectal carcinogenesis by contrast-enhanced ultrasound.
A: Schematic illustration of induction of dextran sodium-sulfate (DSS)/azoxymethane (AOM) colitis. Single intraperitoneal AOM application followed by three cycles of 2.5% (w/v) DSS in drinking water (days 0 to 7, days 21 to 28 and days 42 to 49); B: Schematic illustration of contrast agent ultrasound in highly specific molecularly VEGF-targeted CEUS. Development of tumors after 42 and 84 d after treatment with AOM. White arrows depicting colonic tumor mass. Left panel, B mode images; right panel, corresponding CEUS images; C: Immunhistochemistry staining against VEGF (bright red), cell nuclei were counterstained with DAPI (blue). Positively stained cells were counted in at least 10 representative high power fields per section and cell numbers were expressed semi-quantitatively; D: CEUS with targeted contrast agent against VEGF. Contrast mean power of defined ROI in descending colon in arbitrary unit dB. Decibel values correlate with exposure to DSS in a time-dependent manner. Boxplot with median and whiskers, n = 10 for each group, aP < 0.01. VEGF: Vascular endothelial growth factor; DSS: Dextran sodium-sulfate; CEUS: Contrast-enhanced ultrasound; AOM: Azoxymethane.
- Citation: Brückner M, Heidemann J, Nowacki TM, Cordes F, Stypmann J, Lenz P, Gohar F, Lügering A, Bettenworth D. Detection and characterization of murine colitis and carcinogenesis by molecularly targeted contrast-enhanced ultrasound. World J Gastroenterol 2017; 23(16): 2899-2911
- URL: https://www.wjgnet.com/1007-9327/full/v23/i16/2899.htm
- DOI: https://dx.doi.org/10.3748/wjg.v23.i16.2899


