Copyright
©The Author(s) 2016.
World J Gastroenterol. Sep 7, 2016; 22(33): 7518-7535
Published online Sep 7, 2016. doi: 10.3748/wjg.v22.i33.7518
Published online Sep 7, 2016. doi: 10.3748/wjg.v22.i33.7518
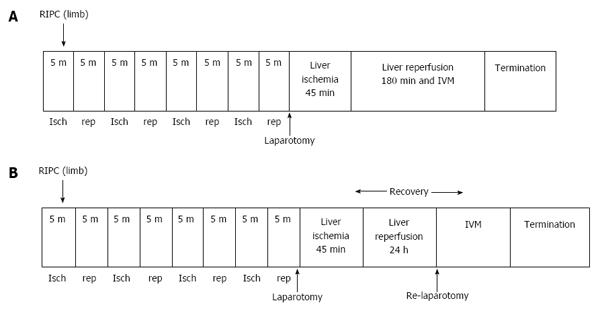
Figure 1 Experimental protocol.
A: Early phase of hepatic IR; B: Late phase of hepatic IR. IR: Ischemia reperfusion.
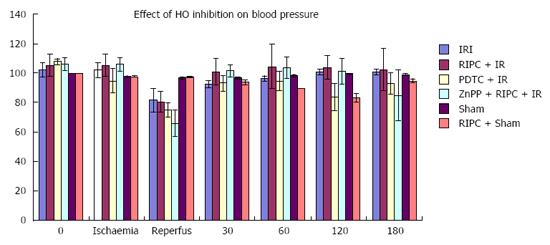
Figure 2 Effect of Haemoxygenase induction and inhibition on blood pressure in hepatic ischemia reperfusion.
RIPC prior to IR restores B.P. to baseline rapidly compared to IR only. Inhibition of HO showed a greater fall in B.P but there was no difference in recovery to baseline. Values expressed as mean + SE. RIPC: Remote ischemic preconditioning; HO: Haemoxygenase; IR: Ischemia reperfusion.
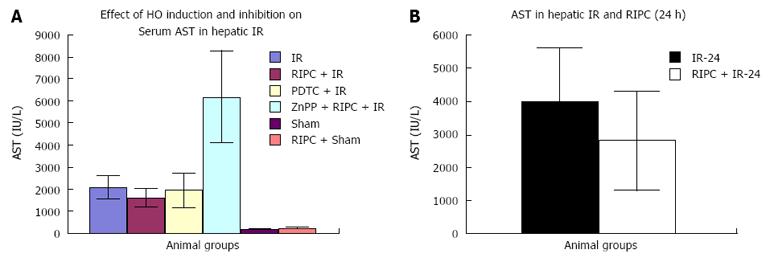
Figure 3 Effect of Haemoxygenase inhibition and induction on hepatic transaminases in the early phase of hepatic ischemia reperfusion.
A: Effect of HO inhibition on AST in early phase IR; B: AST in late phase. No significant difference in hepatic transaminase level IR/RIPC + IR. HO inhibition increased transaminase levels RIPC + IR/ZNPP + RIPC + IR. RIPC: Remote ischemic preconditioning; HO: Haemoxygenase; IR: Ischemia reperfusion.
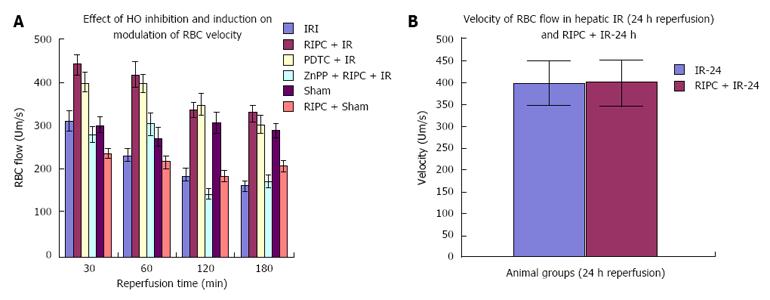
Figure 4 Effect of Haemoxygenase inhibition and induction on velocity of flow in early phase of hepatic ischemia reperfusion (A) and velocity of RBC flow in remote ischemic preconditioning + ischemia reperfusion -24 as compared to ischemia reperfusion -24 (B).
Significant increase in velocity in preconditioned animals prior to ischemia reperfusion injury (RIPC + IRI) as compared to IRI at 30, 60 and 120 min of reperfusion. HO inhibition caused a significant fall in velocity of flow in preconditioned animals. Values expressed as mean ± SE. HO: Haemoxygenase; IR: Ischemia reperfusion; RIPC: Remote ischemic preconditioning; IRI: Ischemia reperfusion injury.
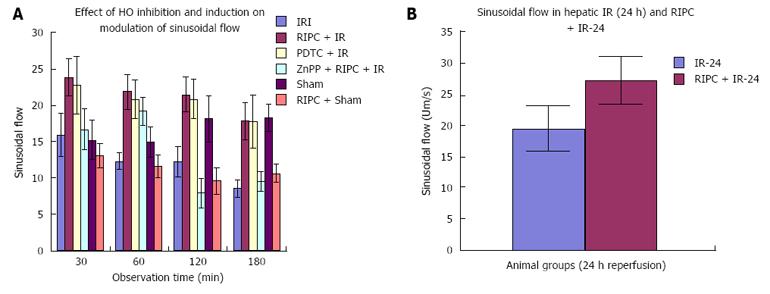
Figure 5 Effect of Haemoxygenase inhibition and induction on sinusoidal flow in early phase of hepatic ischemia reperfusion (A) and sinusoidal flow in late phase of hepatic ischemia reperfusion (B).
Sinusoidal flow - V × (D/2) 2 ×π = V is velocity of RBC, D is sinusoidal diameter. Significantly better flow in preconditioned animals (RIPC + IRI) as compared to non-preconditioned (IR). HO inhibition significantly inhibits flow in preconditioned animals.Values expressed as mean ± SE. Sinusoidal flow - V × (D/2)2 ×π = V is velocity of RBC, D is sinusoidal diameter. Better flow in preconditioned animals (RIPC + IRI-24) as compared to non-preconditioned (IR-24). Values expressed as mean ± SE. HO: Haemoxygenase; IR: Ischemia reperfusion; RIPC: Remote ischemic preconditioning; IRI: Ischemia reperfusion injury.
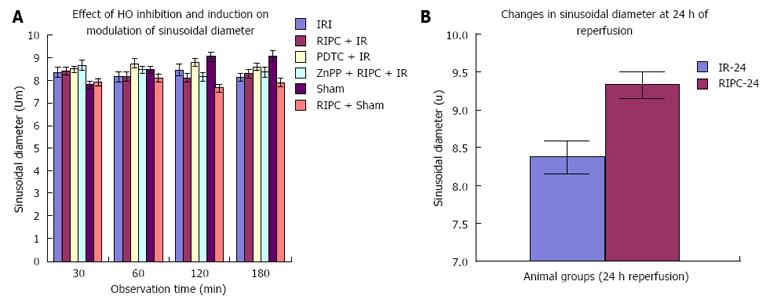
Figure 6 Sinusoidal diameter in late phase of hepatic ischemia reperfusion.
A: Sinusoidal diameter early phase; B: Sinusoidal diameter late phase. No significant change (P > 0.05) in sinusoidal diameter seen in preconditioned animals and on inhibition of HO in the early phase. Sinusoidal diameter - Significantly increased diameter in the preconditioned group (RIPC + IR-24). Values expressed as mean ± SE. P < 0.05, significantly increased sinusoidal diameter in the preconditioned group. HO: Haemoxygenase; IR: Ischemia reperfusion; RIPC: Remote ischemic preconditioning; IRI: Ischemia reperfusion injury.
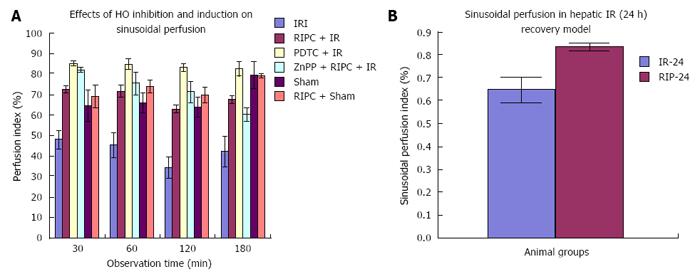
Figure 7 Sinusoidal perfusion in late phase of hepatic ischemia reperfusion.
A: Sinusoidal perfusion early phase; B: Sinusoidal perfusion late phase. Perfusion index in remote preconditioned animals (RIPC + IRI) is significantly higher (P < 0.05) than non-preconditioned animals (IRI). HO inhibition does not affect sinusoidal perfusion in the early stage of IR however sinusoidal perfusion declines at 180 min of reperfusion. Values expressed as mean ± SE. Sinusoidal perfusion index - The PI in remote preconditioned animals (RIPC + IR-24) is significantly higher than non-preconditioned animals (IR-24). Values expressed as mean ± SE. HO: Haemoxygenase; IR: Ischemia reperfusion; RIPC: Remote ischemic preconditioning; IRI: Ischemia reperfusion injury.
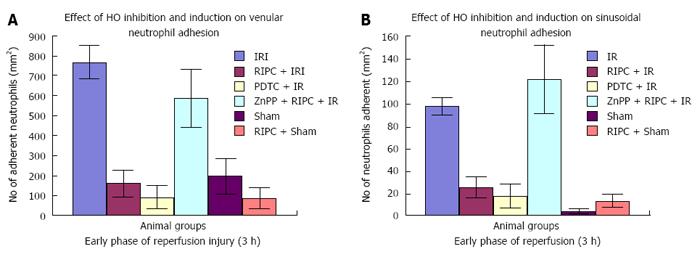
Figure 8 Effect of Haemoxygenase inhibition and induction on Venular neutrophil adhesion in early phase of hepatic ischemia reperfusion.
A: Venular neutrophil adhesion early phase; B: Sinusoidal neutrophil adhesion early phase. Significantly reduced venular neutrophil adhesion in preconditioned (RIPC + IRI) group compared to non-preconditioned group (IRI). HO inhibition in RIPC + IR showed significantly increased venular neutrophil adhesion. Values expressed as mean ± SE. Significantly reduced sinusoidal neutrophil adhesion in preconditioned group (RIPC + IRI) compared to non-preconditioned group (IRI). Values expressed as mean ± SE. HO: Haemoxygenase; IR: Ischemia reperfusion; RIPC: Remote ischemic preconditioning; IRI: Ischemia reperfusion injury.
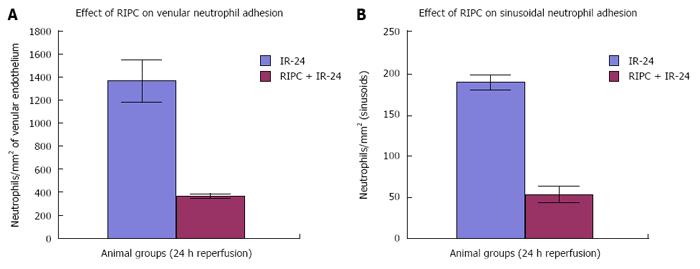
Figure 9 Venular neutrophil adhesion late phase (A) and sinusoidal neutrophil adhesion late phase (B).
Significantly reduced venular neutrophil adhesion in preconditioned (RIPC + IR-24) group compared to non-preconditioned group (IR-24). Significantly reduced sinusoidal neutrophil adhesion in preconditioned group (RIPC + IRI) compared to non-preconditioned group (IRI). Values expressed as mean ± SE.
Figure 10 Hepatocellular cell death is significantly less on Haemoxygenase induction (PDTC + ischemia reperfusion) in hepatic ischemia reperfusion.
A: Hepatocellular death early phase; B: Hepatocellular death late phase. Preconditioning (RIPC + IRI) reproduces effects of HO induction as Hepatocellular cell death in RIPC + IR is significantly less compared to IRI group. HO inhibition prior to preconditioning (ZnPP + RIPC + IR) significantly enhances hepatocellular death in preconditioned animals. Values expressed as mean ± SE. RIPC: Remote ischemic preconditioning; IRI: Ischemia reperfusion injury.
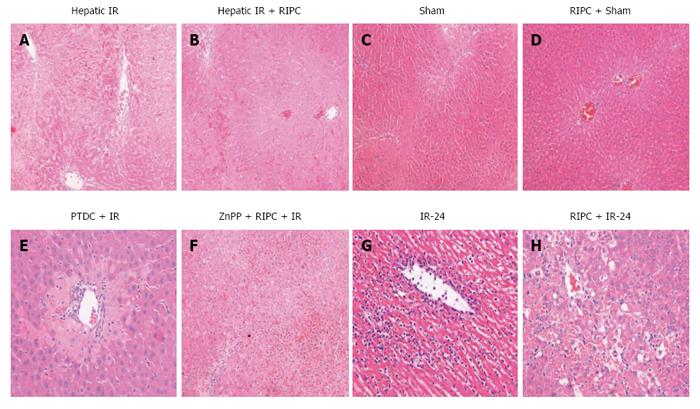
Figure 11 Hepatocytes showed vacuolation.
A: IR - the HE section shows large areas of necrosis and sinusoidal congestion, normal residual hepatocytes noted at bottom of the frame; B: RIPC + IR - The HE section shows sinusoidal congestion, some hepatocyte vacuolation but no significant necrosis; C: Sham - The HE section reveals no significant damage; D: RIPC + Sham - The HE section reveals congested central vein but no other significant change; E: PDTC + IR-diffuse congestion and patchy necrosis; F: ZNPP + RIPC + IR - extensive necrosis seen; G: Very severe injury with abundant ballooning degeneration and necrosis is seen in the IR-24 injury group. Very diffuse and significant neutrophil adhesion is seen in the IR group. Apoptosis is evident in the IR group; H: RIPC + IR-24 group shows less injury with some ballooning and degeneration as well as neutrophilic infiltration. RIPC: Remote ischemic preconditioning; IRI: Ischemia reperfusion injury; HO: Haemoxygenase.
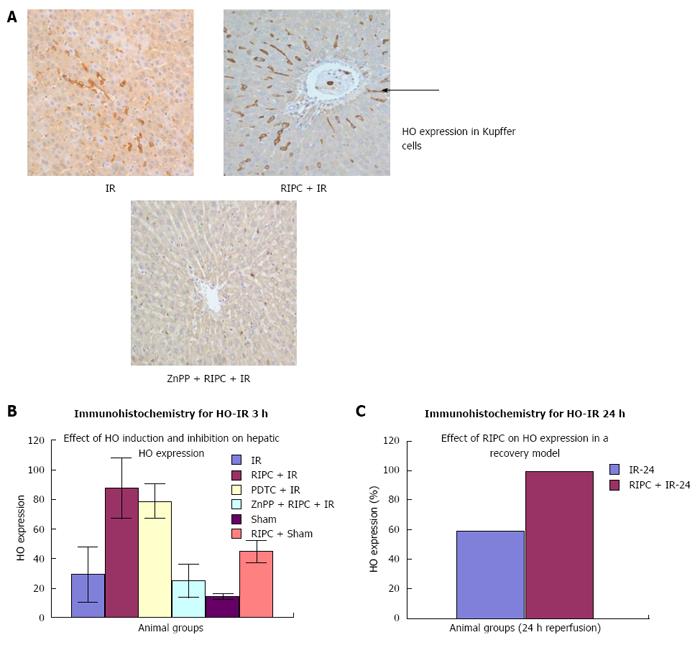
Figure 12 In the late phase of hepatic IR (24 h) there was increased HO expression in both kupffer cells and hepatocytes (parenchymal cells) in preconditioned animals in comparison to IR only.
A: Spatiotemporal distribution of HO - There is some HO expression seen in macrophages (kupffer cells) in IR injury in response to oxidative stress. The expression of HO-1 was significantly more in kupffer cells in the RIPC+IR group. ZNPP + RIPC + IR reduced HO-1 expression; B: HO expression in early phase of hepatic IR; C: HO expression in late phase of hepatic IR.
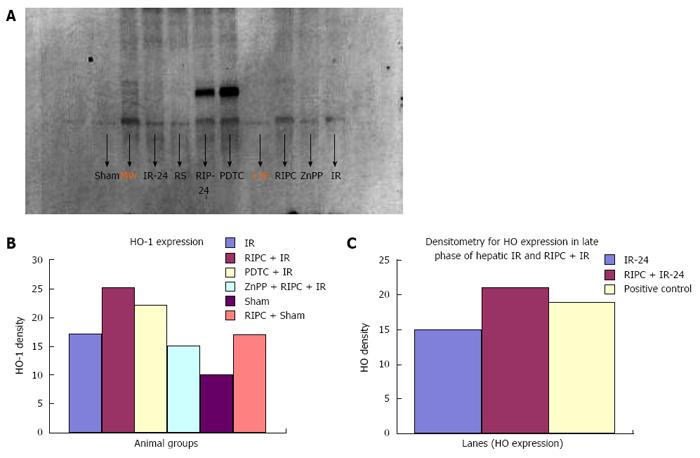
Figure 13 Increased Haemoxygenase expression was seen in all groups + ischemia reperfusion-24 as compared to ischemia reperfusion-24.
A: Western blot analysis for HO in early and late phase of hepatic IR. Lane 1: Sham; Lane 2: MW- 32 Kda for HO protein; Lane 3: IR-24 (HO expression in late phase of hepatic IR) Lane 4-RS; Lane 5: RIPC + IR-24 (effect of RIPC on HO expression in late phase of IR); Lane 6: PDTC- HO inducer; Lane 7: Positive control; Lane 8: ZnPP- HO inhibitor; Lane 9: IR (early phase); B: Densitometry HO expression early phase. Early phase of hepatic IR (above). Densitometry for western blots showing increased HO-1 expression in RIPC + IR and PDTC + IR. Prior inhibition of HO (ZnPP + RIPC IR) significantly reduced HO expression in preconditioned animals; C: Densitometry Ho expression late phase. Densitometry for late phase of hepatic IR and RIPC western blot showing increased HO-1 expression in the RIPC group at 24 h. HO: Haemoxygenase; IR: Ischemia reperfusion.
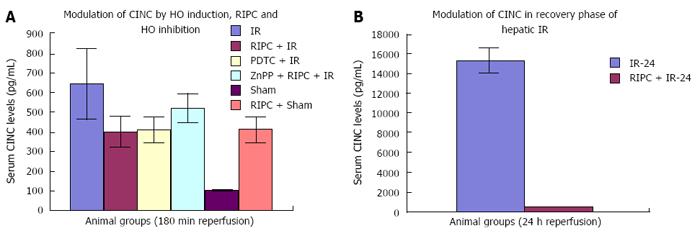
Figure 14 Effect of Haemoxygenase induction and inhibition on CINC.
A: The CINC cytokine levels in sham were low (101.32 ± 6.42). RIPC in sham led to relatively high CINC levels (412.18 ± 65.24) as compared to sham (P < 0.05). Hepatic. IR injury produced high serum CINC level in comparison to sham animals in the early phase of hepatic IR (644.08 ± 181.24) (P < 0.05). RIPC reduced CINC-1 levels in the early phase (401.62 ± 78.56) in comparison to IR only. PDTC (HO inducer) reduced CINC-1 levels in serum in hepatic IR (413.36 ± 63.06). HO inhibition in preconditioned animals with Zinc protoporphyrin increased serum CINC levels (521.81 ± 74.9) (P < 0.05); B: The serum CINC levels were high in the late phase of hepatic IR (15306 ± 1222.04). RIPC reduced CINC levels in the late phase of IR (467.46 ± 26.06). HO: Haemoxygenase; IR: Ischemia reperfusion.
- Citation: Tapuria N, Junnarkar S, Abu-amara M, Fuller B, Seifalian AM, Davidson BR. Haemoxygenase modulates cytokine induced neutrophil chemoattractant in hepatic ischemia reperfusion injury. World J Gastroenterol 2016; 22(33): 7518-7535
- URL: https://www.wjgnet.com/1007-9327/full/v22/i33/7518.htm
- DOI: https://dx.doi.org/10.3748/wjg.v22.i33.7518


