Copyright
©The Author(s) 2016.
World J Gastroenterol. Jan 7, 2016; 22(1): 103-111
Published online Jan 7, 2016. doi: 10.3748/wjg.v22.i1.103
Published online Jan 7, 2016. doi: 10.3748/wjg.v22.i1.103
Figure 1 Gadoxetic acid contrast-enhanced magnetic resonance images obtained in a 46-year-old woman with normal liver.
Contrast-enhanced magnetic resonance images show a stepwise intensity increase of the liver parenchyma from the hepatic arterial phase to hepatobiliary phase. On hepatic arterial and portal venous phases (vascular phase), the intrahepatic vessels show intense and homogeneous enhancement. On 3 min late and 5 min late phases (transitional phase), the intrahepatic vessels (open arrows) show isointensity to the liver, indicating the transition of gadoxetic acid from the extra-cellular spaces to the hepatocellular-spaces. On 10 min and 20 min phase (hepatobiliary phase), the intrahepatic vessels show hypointensity to the liver, while the bile ducts (arrows) show hyperintensity; these findings indicate an adequate hepatobiliary phase. Also note kidney hypointensity to the liver, which indicates normal hepatobiliary elimination of gadoxetic acid and adequate hepatobiliary phase. PRE: Precontrast; HAP: Late hepatic arterial phase; PVP: Portal venous phase.
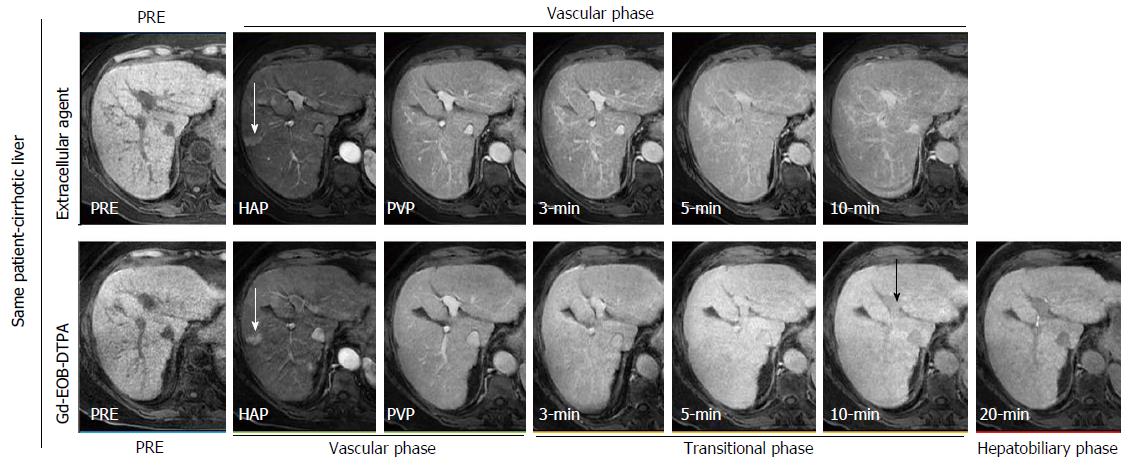
Figure 2 Intraindividual differences in hepatic enhancement in cirrhotic liver between extra-cellular contrast agent (top row) and gadoxetic acid (bottom row) in a 69-year-old woman with hepatitis C virus-related cirrhosis.
On contrast-enhanced magnetic resonance (MR) images obtained with an extra-cellular agent liver enhancement peaks on portal venous phase and then slightly decreases. On contrast-enhanced MR images obtained with gadoxetic acid, liver enhancement shows a stepwise increase from the hepatic arterial phase to the 20 min phase. Vascular enhancement is more prolonged with extra-cellular agent than with gadoxetic acid, indicating a slower vascular elimination. On 10 min, the intrahepatic vessels (black arrow) show slight hypointensity to the liver, and the bile ducts are not opacified. These findings indicate hepatic dysfunction and a prolonged transitional phase. Also, note a wedge shaped enhancing area in the hepatic arterial phase (white arrow), with lack of washout on portal venous phase and isointensity on hepatobiliary phase, due to arterioportal shunt. PRE: Precontrast; HAP: Late hepatic arterial phase; PVP: Portal venous phase.
Figure 3 Gadoxetic acid contrast-enhanced magnetic resonance images obtained in a 57-year-old man with Child-Pugh C hepatitis C virus-related cirrhosis.
Contrast-enhanced magnetic resonance images show slight decrease of liver enhancement after the portal venous phase. On hepatic arterial and portal venous phases, the intrahepatic vessels show intense and homogeneous enhancement, which persists on 3 min, 5 min, and 10 min phase. On 20 min phase, the intrahepatic vessels show isointensity to the liver. Prolonged retention of the contrast in intrahepatic vessels indicates impaired hepatic function and an inadequate hepatobiliary phase. Twenty minutes phase corresponds in this case to the transitional phase observed in normal liver patient due to prolonged retention of gadoxetic acid in intrahepatic vessels. Also, note that the kidney shows isointensity to the liver on 10 min and 20 min phases, indicating a compensatory increase of renal elimination of gadoxetic acid and an inadequate hepatobiliary phase. PRE: Precontrast; HAP: Late hepatic arterial phase; PVP: Portal venous phase.
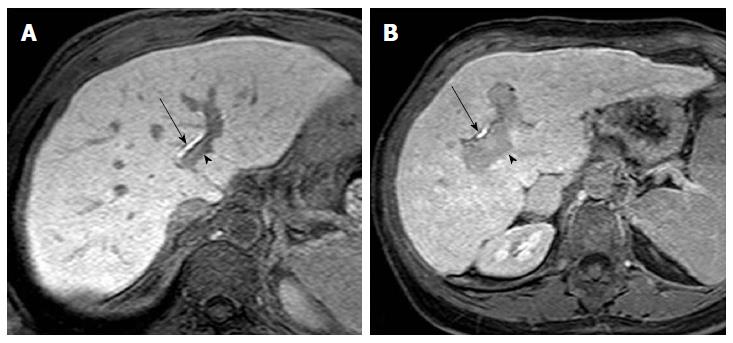
Figure 4 Twenty-minute hepatobiliary phase gadoxetic acid enhanced magnetic resonance imaging obtained in a 67-year-old man with Child-Pugh class A hepatitis C virus-related cirrhosis (A) and in a 67-year-old woman with Child-Pugh class B hepatitis C virus-related cirrhosis (B).
A: The liver shows high signal intensity compared with the portal vein (arrowhead), which shows hypointensity; B: The liver shows relative high signal intensity compared with the portal vein (arrowhead), which shows “less” hypointensity if compared with A. Visual comparison of signal intensity of the liver relative to the portal vein can be used to evaluate adequacy of hepatobiliary phase. Enhancement of bile ducts, noted in both A and B (arrows), cannot be used alone to indicate adequacy of hepatobiliary phase.
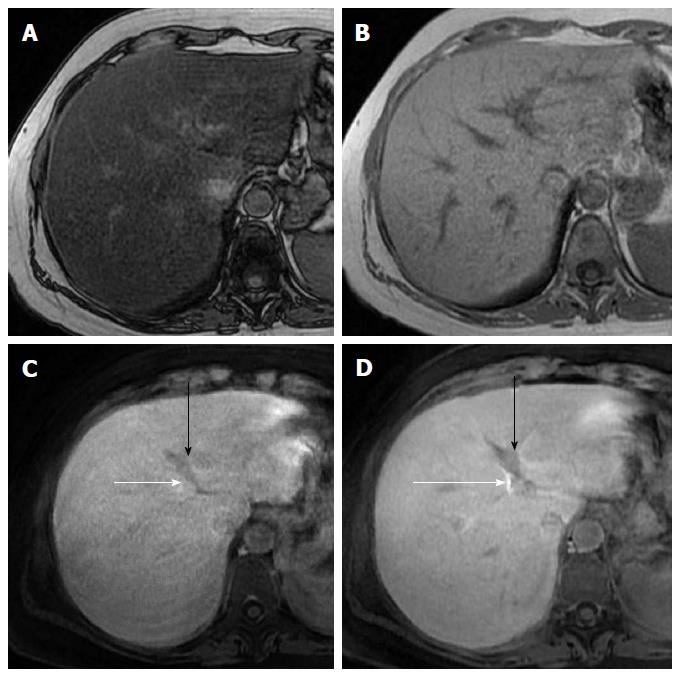
Figure 5 Reduced hepatobiliary phase enhancement due to severe hepatic steatosis in a 42-year-old woman with hepatitis C virus-related chronic hepatitis.
A, B: T1-weighted gradient-echo images show diffuse signal intensity decrease of the liver on out-of-phase (A) image compared with that on the in-phase image (B), indicating severe hepatic steatosis; C: On 10 min hepatobiliary phase, gadoxetic acid enhanced magnetic resonance imaging, left portal vein (black arrow) shows iso- to hypointensity to liver parenchyma; D: On 20 min hepatobiliary phase left portal vein shows slight hypointensity to liver parenchyma. Enhancement of bile ducts (white arrows) is less intense on 10 min hepatobiliary phase than that on 20 min hepatobiliary phase, indicating delayed biliary elimination of gadoxetic acid.
- Citation: Agnello F, Dioguardi Burgio M, Picone D, Vernuccio F, Cabibbo G, Giannitrapani L, Taibbi A, Agrusa A, Bartolotta TV, Galia M, Lagalla R, Midiri M, Brancatelli G. Magnetic resonance imaging of the cirrhotic liver in the era of gadoxetic acid. World J Gastroenterol 2016; 22(1): 103-111
- URL: https://www.wjgnet.com/1007-9327/full/v22/i1/103.htm
- DOI: https://dx.doi.org/10.3748/wjg.v22.i1.103


