Copyright
©The Author(s) 2016.
World J Gastroenterol. Jan 7, 2016; 22(1): 103-111
Published online Jan 7, 2016. doi: 10.3748/wjg.v22.i1.103
Published online Jan 7, 2016. doi: 10.3748/wjg.v22.i1.103
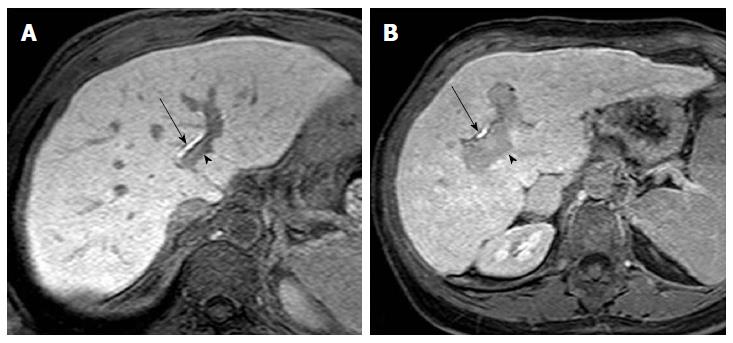
Figure 4 Twenty-minute hepatobiliary phase gadoxetic acid enhanced magnetic resonance imaging obtained in a 67-year-old man with Child-Pugh class A hepatitis C virus-related cirrhosis (A) and in a 67-year-old woman with Child-Pugh class B hepatitis C virus-related cirrhosis (B).
A: The liver shows high signal intensity compared with the portal vein (arrowhead), which shows hypointensity; B: The liver shows relative high signal intensity compared with the portal vein (arrowhead), which shows “less” hypointensity if compared with A. Visual comparison of signal intensity of the liver relative to the portal vein can be used to evaluate adequacy of hepatobiliary phase. Enhancement of bile ducts, noted in both A and B (arrows), cannot be used alone to indicate adequacy of hepatobiliary phase.
- Citation: Agnello F, Dioguardi Burgio M, Picone D, Vernuccio F, Cabibbo G, Giannitrapani L, Taibbi A, Agrusa A, Bartolotta TV, Galia M, Lagalla R, Midiri M, Brancatelli G. Magnetic resonance imaging of the cirrhotic liver in the era of gadoxetic acid. World J Gastroenterol 2016; 22(1): 103-111
- URL: https://www.wjgnet.com/1007-9327/full/v22/i1/103.htm
- DOI: https://dx.doi.org/10.3748/wjg.v22.i1.103


