Copyright
©The Author(s) 2015.
World J Gastroenterol. Sep 14, 2015; 21(34): 9927-9935
Published online Sep 14, 2015. doi: 10.3748/wjg.v21.i34.9927
Published online Sep 14, 2015. doi: 10.3748/wjg.v21.i34.9927
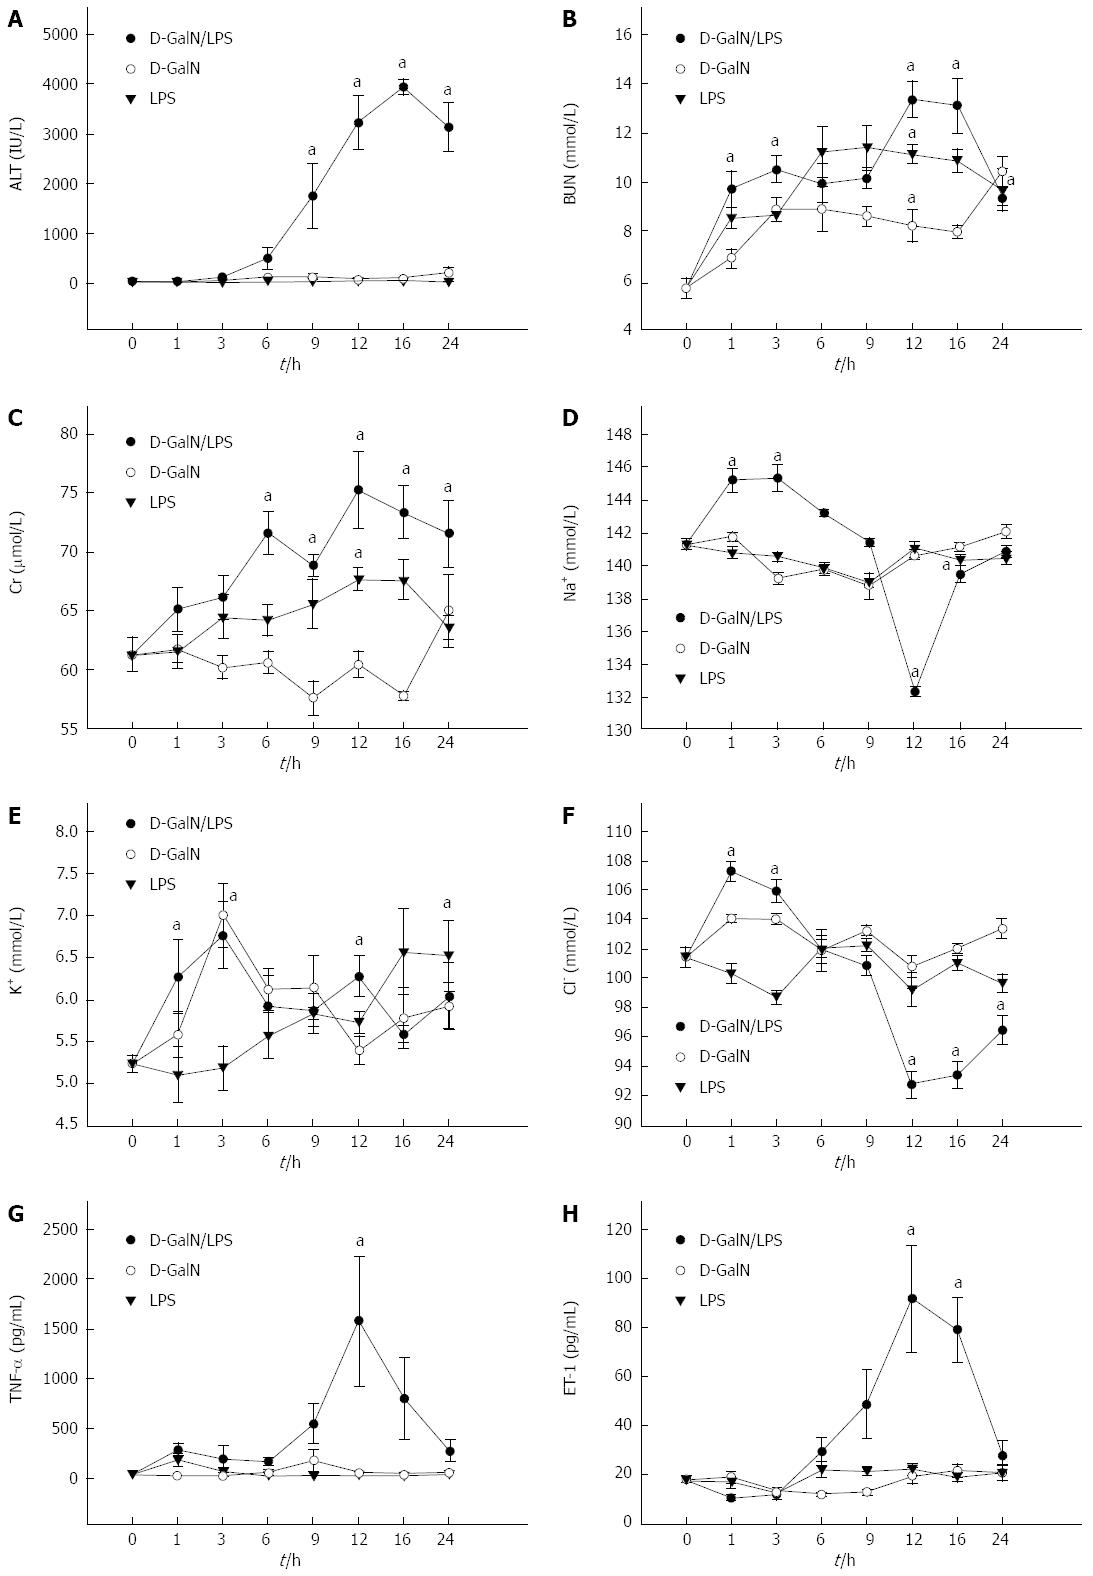
Figure 1 Serum levels of biochemical indicators and cytokines.
D-GalN 400 mg/kg and LPS 32 μg/kg in normal saline were intravenously injected via the tail vein. A: ALT (IU/L); B: BUN (mmol/L); C: Cr (μmol/L); D: Na+ (mmol/L); E: K+ (mmol/L); F Cl- (mmol/L); G: TNFα (pg/mL); H: ET-1 (pg/mL). aP < 0.05, G/L vs NS. D-GalN: D-galactosamine; LPS: Lipopolysaccharide; TNF-α: Tumor necrosis factor α; ET-1: Endothelin-1; ALT: Alanine aminotransferase; BUN: Blood urea nitrogen.
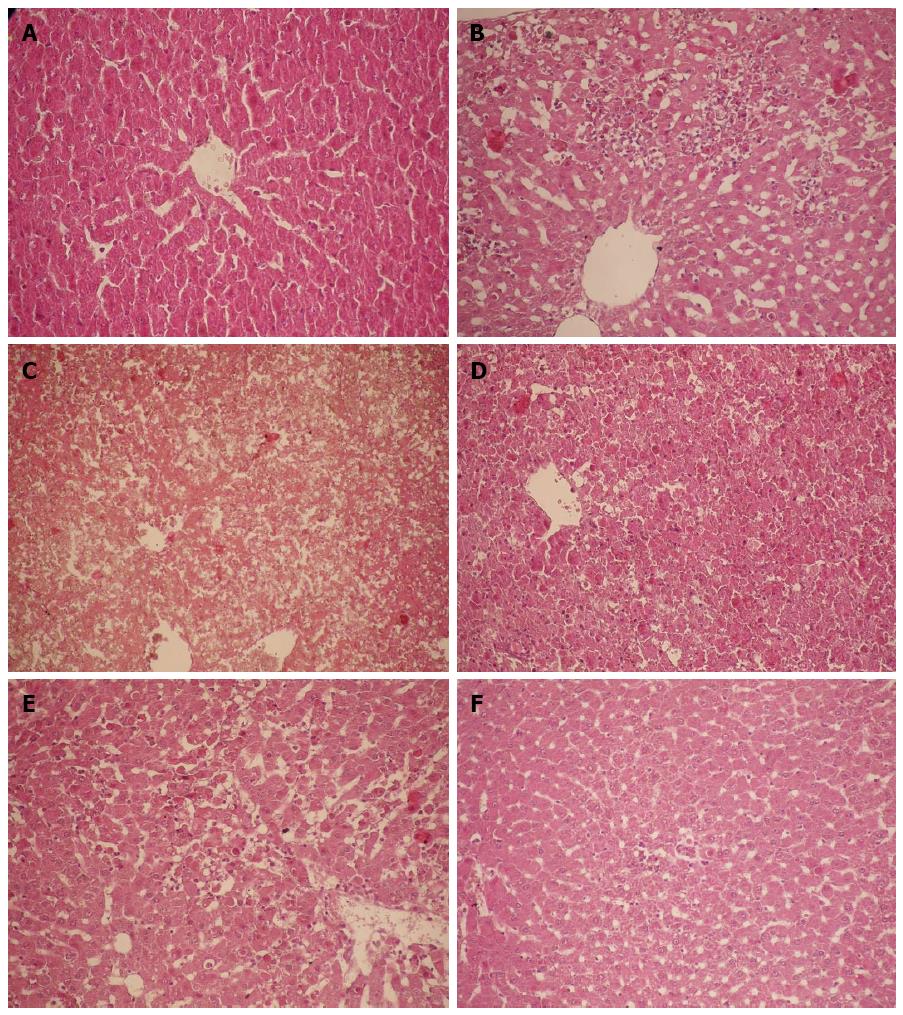
Figure 2 Histopathology of the liver (HE, × 200).
A: In the NS group, hepatocytes were arranged in chords; B: In the GalN/LPS group at 6 h, focal necrosis of hepatocytes was visible; C: In the GalN/LPS group at 12 h, massive hemorrhagic hepatic necrosis was visible; D: In the GalN/LPS group at 24 h, massive hemorrhagic hepatic necrosis was visible; E: In the GalN group at 12 h, focal necrosis of hepatocytes was visible; F: In the LPS group at 12 h, hepatocytes began to show necrosis, and incomplete necrosis was observed in some hepatocytes. D-GalN: D-galactosamine; LPS: Lipopolysaccharide; NS: Normalsaline.
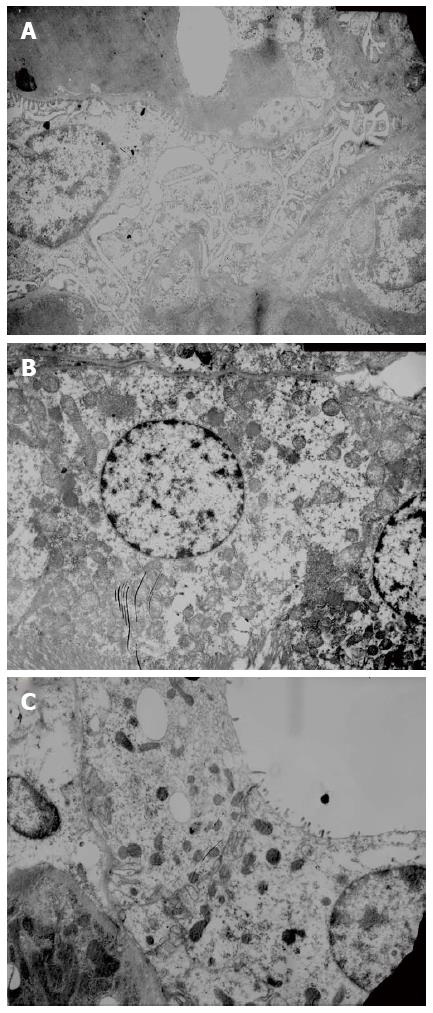
Figure 3 Histopathology of the kidney.
A: Glomeruli: Glomerular basement membrane was intact, and the pedicles of podocytes and fenestrations on endothelial cells could be clearly seen; B: Proximal tubules: The base of cuboidal epithelial cells of proximal tubules showed many plasma membrane infolds, in which many mitochondria with intact cristae were visible, and the microvilli on the luminal surface of proximal tubules were long and thick; C: Distal tubules: The base of cuboidal epithelial cells of distal tubules also contained plasma membrane infolds, in which many mitochondria were visible. The microvilli on the luminal surface of distal tubules were short and sparse.
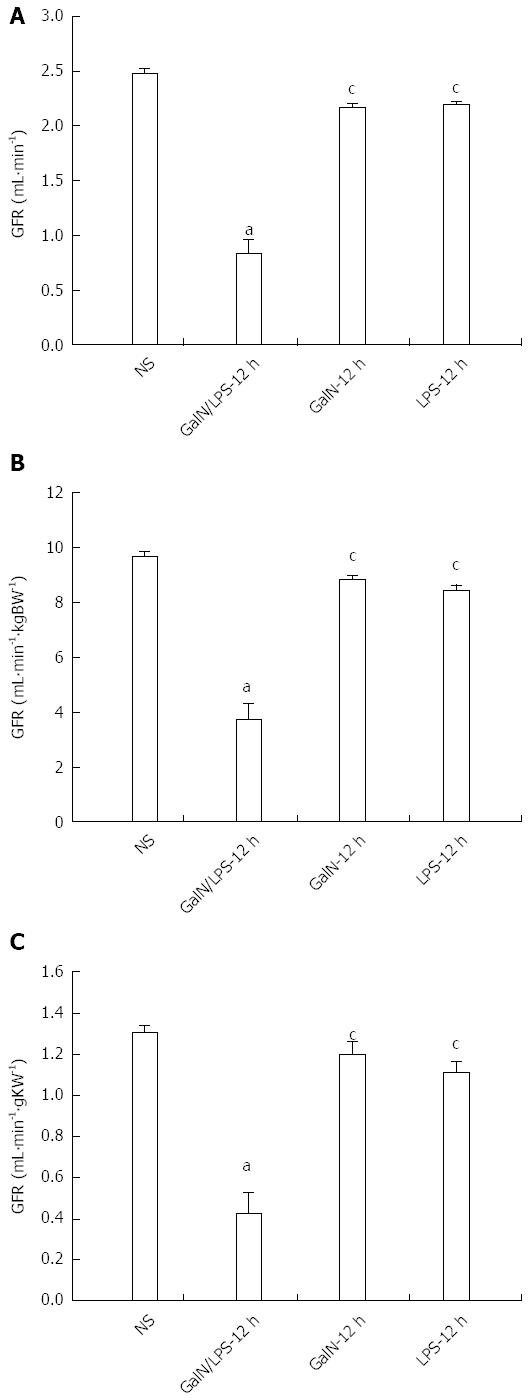
Figure 4 Comparisons of glomerular filtration rate for rats in each group.
A: GFR1 (mL·min-1); B: GFR2 (mL·min-1·kgBW-1); C: GFR3 (mL·min-1·gKW-1). GFR1, GFR2 and GFR3 decreased significantly in the GalN/LPS group compared with the NS, GalN and LPS groups (aP < 0.05 vs NS; cP < 0.05 vs GalN/LPS-12 h). D-GalN: D-galactosamine; LPS: Lipopolysaccharide; GFR: Glomerular filtration rate; NS: Normalsaline.
- Citation: Wang JB, Wang HT, Li LP, Yan YC, Wang W, Liu JY, Zhao YT, Gao WS, Zhang MX. Development of a rat model of D-galactosamine/lipopolysaccharide induced hepatorenal syndrome. World J Gastroenterol 2015; 21(34): 9927-9935
- URL: https://www.wjgnet.com/1007-9327/full/v21/i34/9927.htm
- DOI: https://dx.doi.org/10.3748/wjg.v21.i34.9927


