Copyright
©The Author(s) 2015.
World J Gastroenterol. Jan 21, 2015; 21(3): 711-725
Published online Jan 21, 2015. doi: 10.3748/wjg.v21.i3.711
Published online Jan 21, 2015. doi: 10.3748/wjg.v21.i3.711
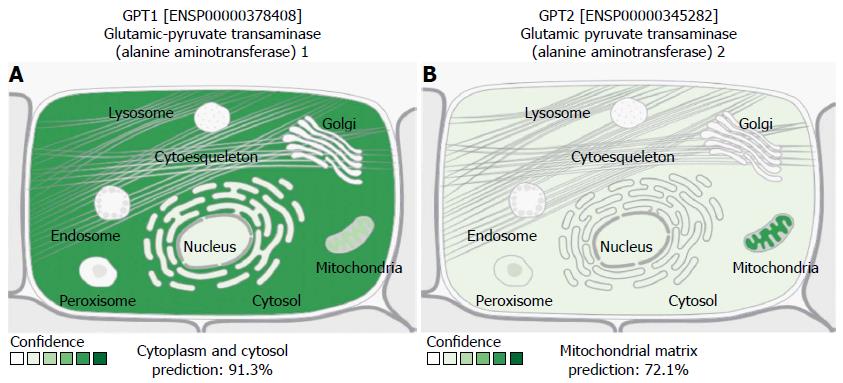
Figure 1 Schematic representation of different localizations of ALT1 (GPT1) and ALT2 (GPT2) proteins at the cellular level.
Prediction was performed by the open access web resource “COMPARTMENTS” available at http://compartments.jensenlab.org, which predicts protein localization according to information extracted from different databases, including UniProtKB, as well as cellular component ontologies visualized by the Gene Ontology Consortium. The program generates unified confidence scores of the localization evidence; confidence scale is color coded, ranging from light green (1) indicating low confidence, to dark green (5), corresponding to high confidence, with absence of localization evidence depicted in white (0). The evidence score is expressed in %.
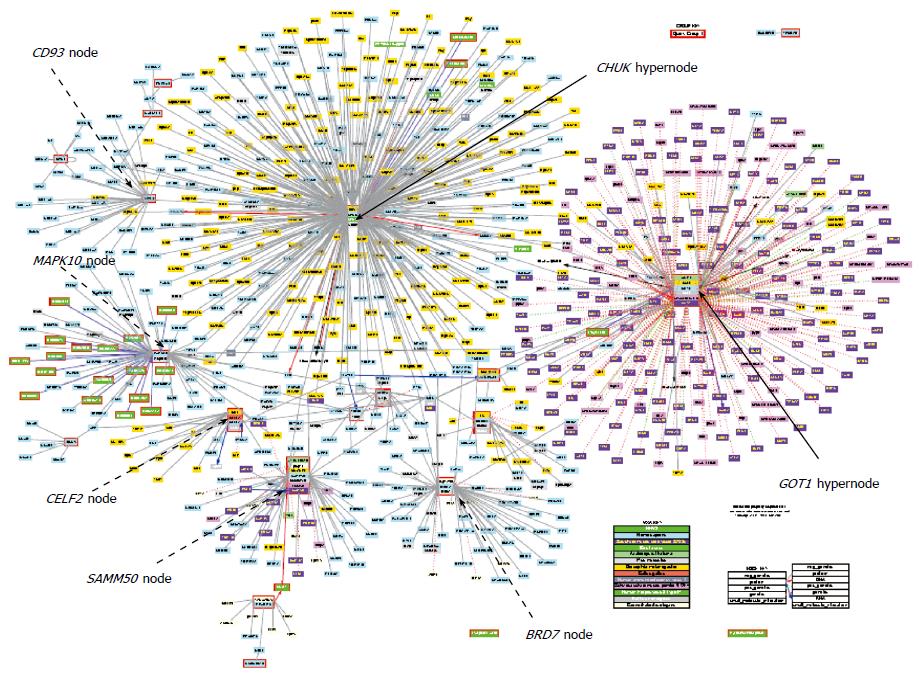
Figure 2 Visualization of biomolecular interactions among associated loci with serum levels of alanine-aminotransferase and aspartate-aminotransferase in published genome-wide association studies.
Prediction was based on the Cognoscente program, freely available at the web-based submission portal: http://vanburenlab.tamhsc.edu/cognoscente.html. The interaction network image shows 828 nodes with different levels of complexity; black arrows indicate the major nodes. Additional interconnectivity nodes of importance (highlighted in black dashed arrows) are SAMM50, CD93 (highly connected with CHUK), MAPK10, CELF2 and BRD7. Prediction by Cognoscente supports multiple organisms in the same query, as well as gene-gene, gene-protein, protein-RNA and protein-DNA interactions, and multi-molecule queries[77]. The input list was based on the gene list presented in Table 4, while the graph depicts known interactions the query list members.
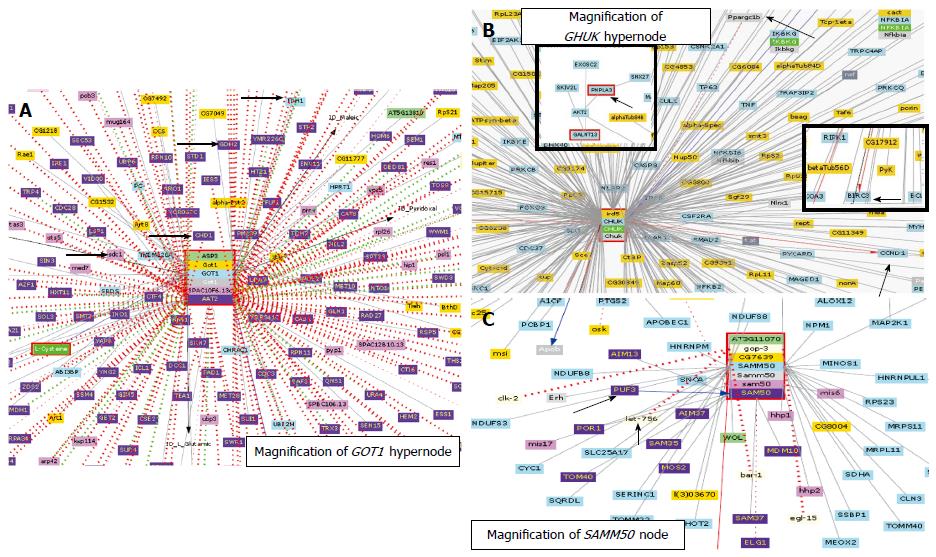
Figure 3 Biomolecular interactions focused on hypernodes (GOT1 and CHUK) and nodes (SAMM50) predicted by the visualization tool for systems biology Cognoscente.
Cognoscente currently contains over 413000 documented interactions, with coverage across multiple species, including Homo sapiens, Saccharomyces cerevisiae, Drosophila melanogaster, Schizosaccharomyces pombe, Arabidopsis thaliana, Mus musculus, and Caenorhabditis elegans, among others[74]. Colors under the hypernode/node gene name denote different species; for example, light blue corresponds to homo sapiens, blue to saccharomyces cerevisiae S288c and violet to schizosaccharomyces pombe; light green is arabidopsis thaliana, orange is Drosophila melanogaster, red is Gallus gallus, gray is rattus norvegicus and pale gray is caenorhabditis elegans. Arrows highlight biomolecular interactions discussed in the body of the manuscript.
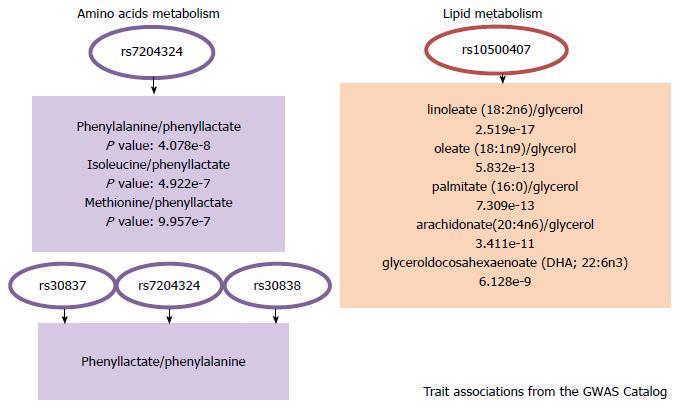
Figure 4 GOT2: Trait associations from the genome-wide association studies Catalog.
Significant associations were extracted from the Metabolomics genome-wide association studies Server, freely available at http://metabolomics.helmholtz-muenchen.de/gwas/index.php. This site contains the association results of two genome-wide association studies on the human metabolome[46,78]. GWAS: Genome-wide association studies.
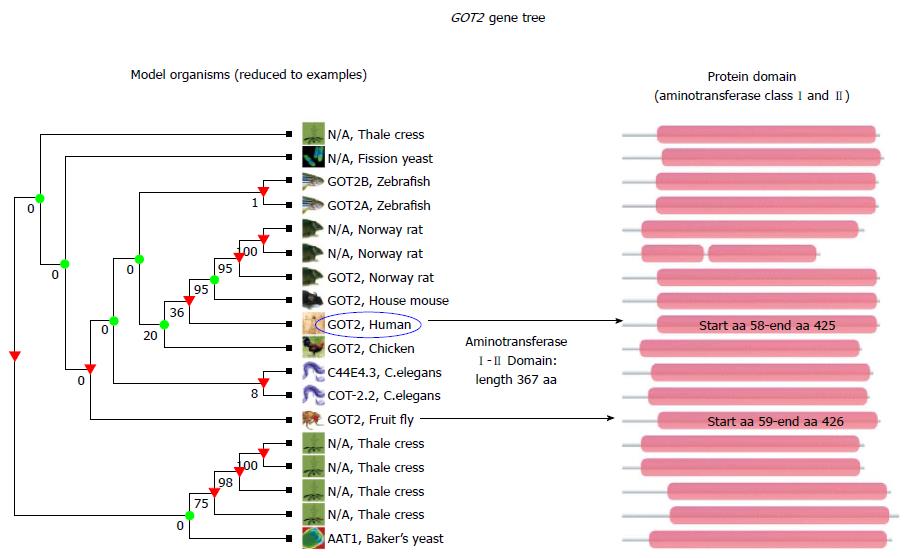
Figure 5 Conservation analysis of GOT2 between species.
Cladogram shows the relationships between GOT2 genes in different species; for simplicity reasons species were restricted to few models. An alignment of all homologous sequences (protein domain) in the TreeFam family is represented in pink, displayed on the left side of the graph. Numbers below branches are bootstrap values, whereby 100% indicates strong support for these nodes, whereas other nodes receive much weaker support (e.g., 0%). Arrows highlight aminotransferase class I and II domain in human and fruit fly (aa: amino acid). TreeFam gene was created by using the resource TreeFam, freely available at http://www.treefam.org/family.
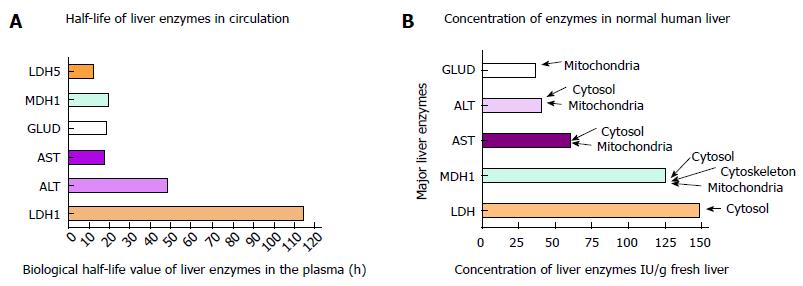
Figure 6 Liver enzyme concentrations in normal human liver.
Information of the liver concentration of major liver enzymes was extracted from the report published by Wieme et al[58]. Evidence of subcellular locations from the Compartments database (http://compartments.jensenlab.org) is highlighted. LDH5: Human isoform-5 of lactate dehydrogenase, which is normally present in the liver; GLUD: Glutamate dehydrogenase; ALT: Alanine aminotransferase; AST: Aspartate aminotransferase; MDH1: Malate dehydrogenase; LDH: Lactate dehydrogenase.
- Citation: Sookoian S, Pirola CJ. Liver enzymes, metabolomics and genome-wide association studies: From systems biology to the personalized medicine. World J Gastroenterol 2015; 21(3): 711-725
- URL: https://www.wjgnet.com/1007-9327/full/v21/i3/711.htm
- DOI: https://dx.doi.org/10.3748/wjg.v21.i3.711


