Copyright
©The Author(s) 2015.
World J Gastroenterol. Jan 21, 2015; 21(3): 711-725
Published online Jan 21, 2015. doi: 10.3748/wjg.v21.i3.711
Published online Jan 21, 2015. doi: 10.3748/wjg.v21.i3.711
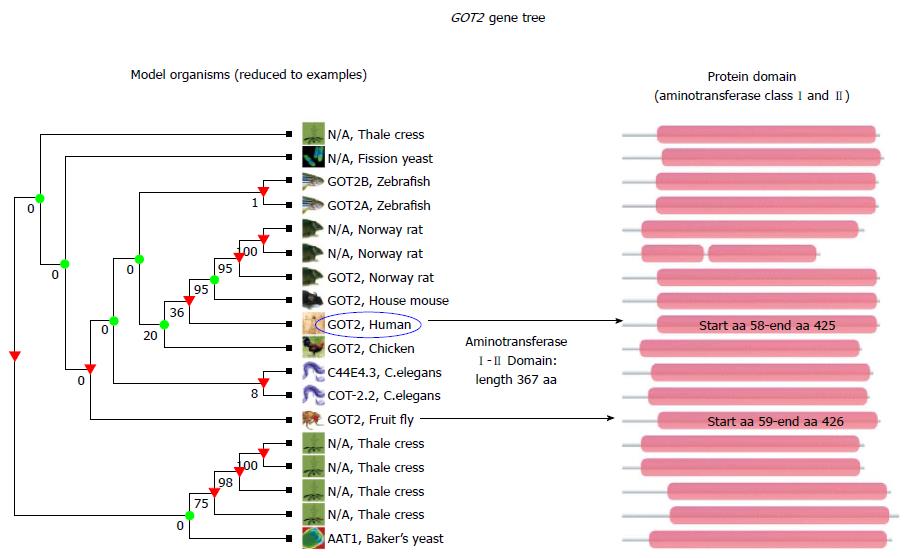
Figure 5 Conservation analysis of GOT2 between species.
Cladogram shows the relationships between GOT2 genes in different species; for simplicity reasons species were restricted to few models. An alignment of all homologous sequences (protein domain) in the TreeFam family is represented in pink, displayed on the left side of the graph. Numbers below branches are bootstrap values, whereby 100% indicates strong support for these nodes, whereas other nodes receive much weaker support (e.g., 0%). Arrows highlight aminotransferase class I and II domain in human and fruit fly (aa: amino acid). TreeFam gene was created by using the resource TreeFam, freely available at http://www.treefam.org/family.
- Citation: Sookoian S, Pirola CJ. Liver enzymes, metabolomics and genome-wide association studies: From systems biology to the personalized medicine. World J Gastroenterol 2015; 21(3): 711-725
- URL: https://www.wjgnet.com/1007-9327/full/v21/i3/711.htm
- DOI: https://dx.doi.org/10.3748/wjg.v21.i3.711


