Copyright
©The Author(s) 2015.
World J Gastroenterol. Jul 7, 2015; 21(25): 7754-7763
Published online Jul 7, 2015. doi: 10.3748/wjg.v21.i25.7754
Published online Jul 7, 2015. doi: 10.3748/wjg.v21.i25.7754
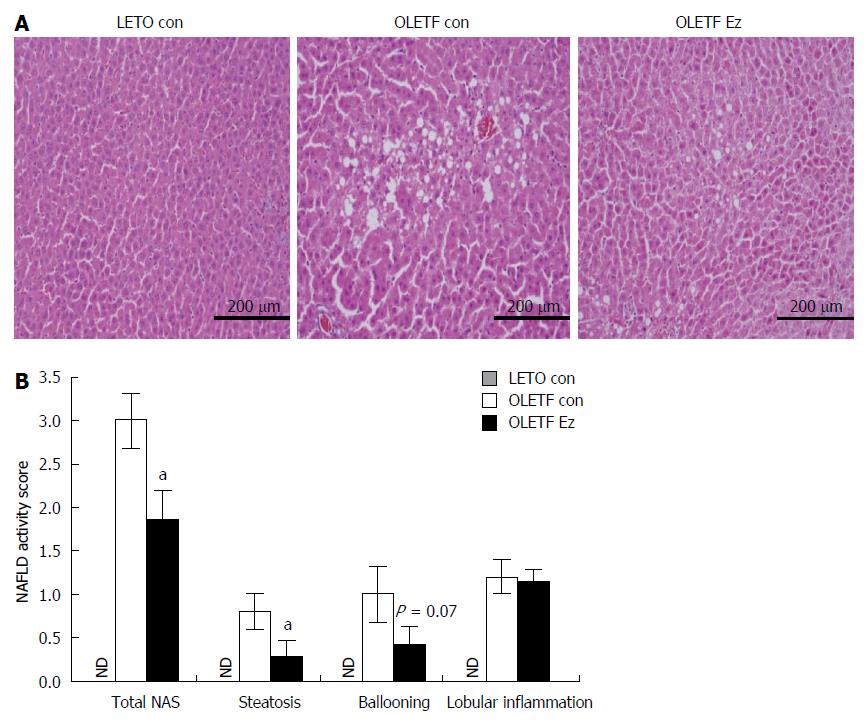
Figure 1 Ezetimibe improves hepatic steatosis in OLETF rats.
A: Representative HE liver sections (scale bar, 200 μm; magnification × 200); B: NAFLD activity score. Data are expressed as the mean ± SE. aP < 0.05 vs OLETF control. ND: Not detected in LETO control (LETO con); white bar: OLETF control (OLETF con); black bar: OLETF ezetimibe group (OLETF Ez); NAFLD: Nonalcoholic fatty liver disease.
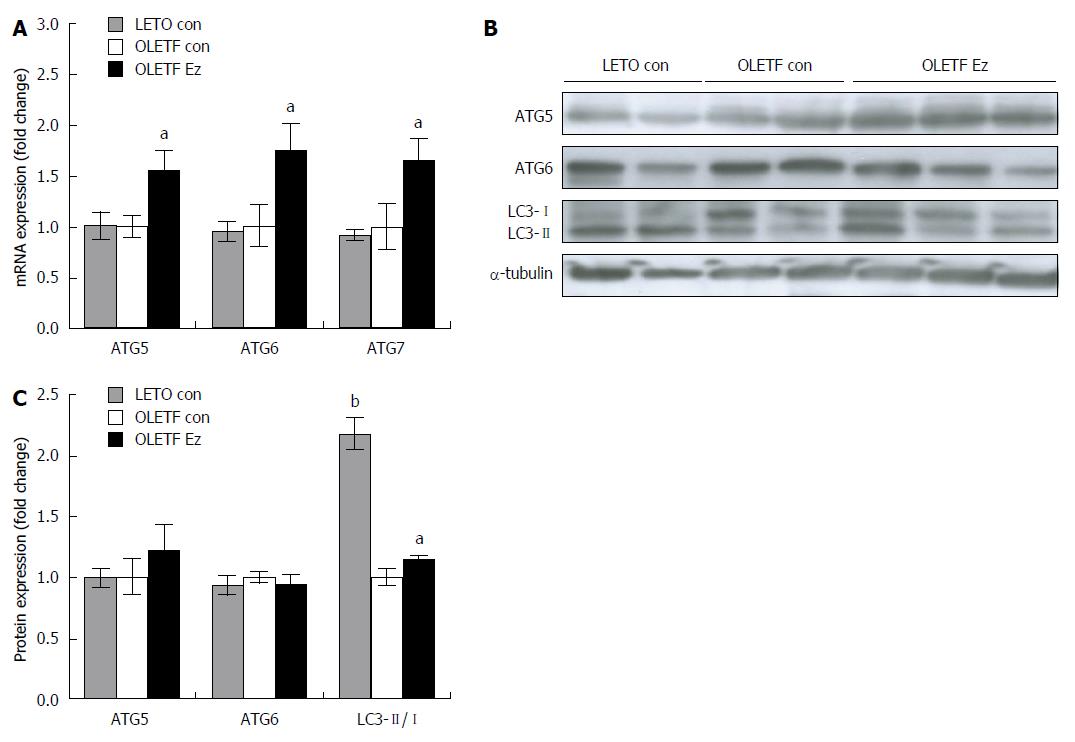
Figure 2 Ezetimibe increases autophagy makers in OLETF liver tissue.
mRNA level (A) and protein expression (B and C) was measured and expressed as the fold change compared to OLETF control. ATG 5 and 6 protein expression was normalized by α-tubulin and LC3 protein abundance was expressed as the ratio between LC3-II (14 kDa) and LC3-I (16 kDa). Results are presented as mean ± SE. aP < 0.05, bP < 0.01 vs OLETF control. ATG: Autophagy-related gene; LETO con: LETO control; OLETF con: OLETF control; OLETF Ez: OLETF ezetimibe.
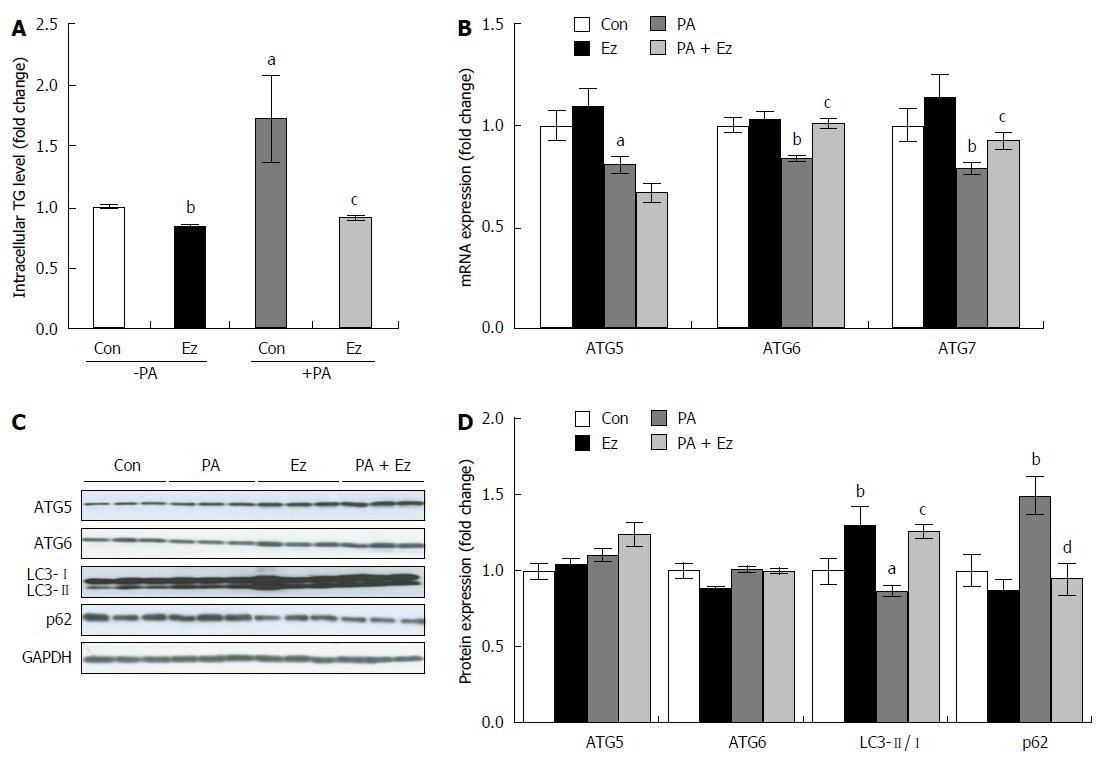
Figure 3 Ezetimibe treatment attenuates triglycerides accumulation and induces autophagy in hepatocytes.
Hepatic triglyceride concentration (A) and mRNA (B) and protein expression (C and D) involved in autophagy were expressed as the mean ± SE. Experiments represent at least three independent experiments (n≥ 9). aP < 0.05, bP < 0.01, vs control; cP < 0.05, dP < 0.01, PA vs PA + Ez. ATG: Autophagy-related gene; Con: Control; Ez: Ezetimibe; GAPDH: Glyceraldehyde 3-phosphate dehydrogenase; PA: Palmitic acid; TG: Triglycerides.
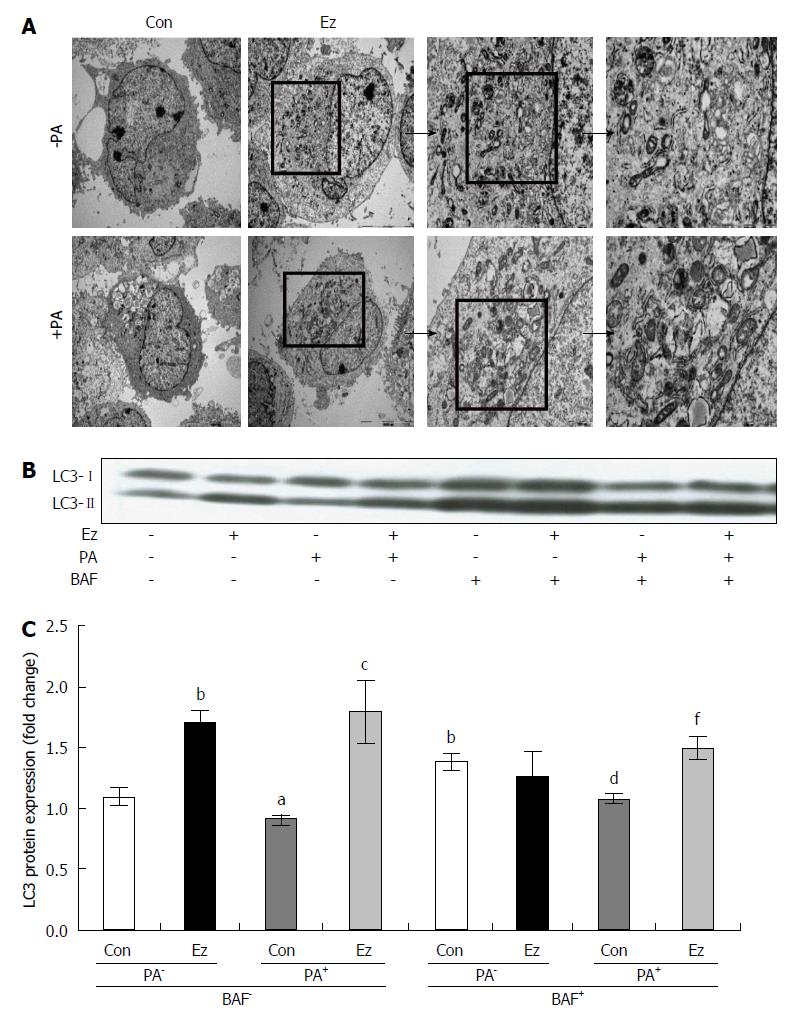
Figure 4 Ezetimibe increases autophagosome formation and autophagic flux in hepatocytes.
Electron microscopy of hepatocytes demonstrated ezetimibe-induced autophagy (A). Representative blot (B) and quantitative analysis (C) expressed as LC3-II (14 kDa)/LC3-I (16 kDa) followed by sample/control (mean ± SE). aP < 0.05, bP < 0.01, vs control in the absence of PA and BAF; cP < 0.05, PA vs PA + Ez in the absence of BAF; dP < 0.01, vs control in the absence of PA but in the presence of BAF. fP < 0.01, PA vs PA + Ez in the presence of BAF. BAF: Bafilomycin A1; Con: Control; Ez: Ezetimibe; PA: Palmitic acid.
- Citation: Chang E, Kim L, Park SE, Rhee EJ, Lee WY, Oh KW, Park SW, Park CY. Ezetimibe improves hepatic steatosis in relation to autophagy in obese and diabetic rats. World J Gastroenterol 2015; 21(25): 7754-7763
- URL: https://www.wjgnet.com/1007-9327/full/v21/i25/7754.htm
- DOI: https://dx.doi.org/10.3748/wjg.v21.i25.7754


