Copyright
©The Author(s) 2015.
World J Gastroenterol. May 14, 2015; 21(18): 5685-5694
Published online May 14, 2015. doi: 10.3748/wjg.v21.i18.5685
Published online May 14, 2015. doi: 10.3748/wjg.v21.i18.5685
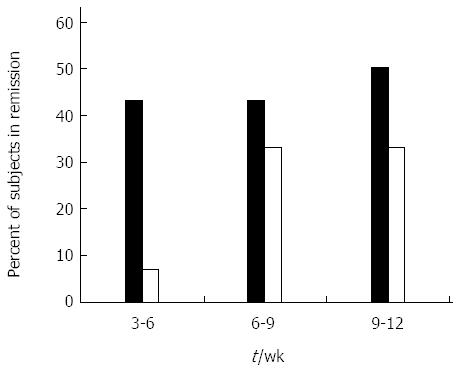
Figure 1 Effect of oral administration of AlequelTM on clinical remission.
Percent of subjects in clinical remission (Crohn’s disease activity index < 150) during the course of the study. Black bars represent the AlequelTM-treated group and open bars represent the placebo group. The evaluable number of patients in each group was too small to reach a statistical significance.
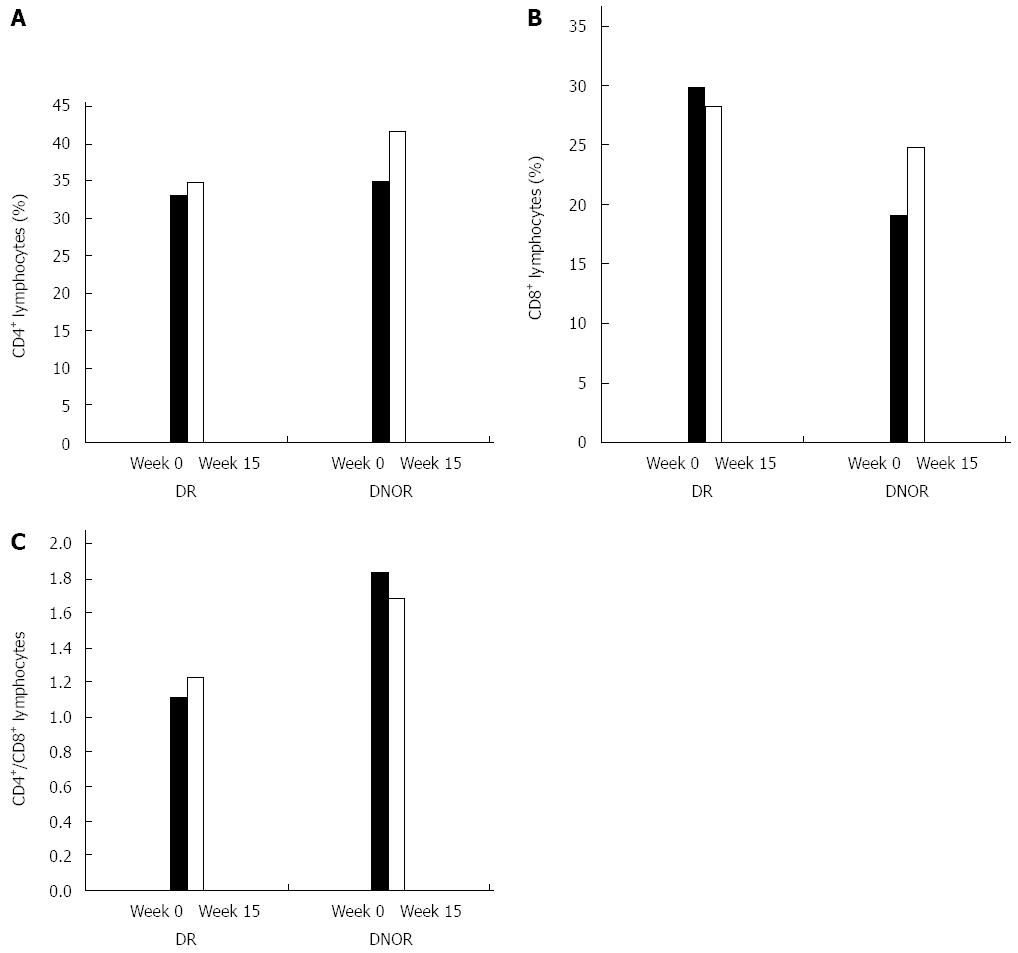
Figure 2 Effect of oral administration of AlequelTM on peripheral blood T cell populations.
Flow cytometry bioinformatics analysis of CD4+ and CD8+ lymphocyte subsets was performed. The effect was analyzed based on response to treatment comparing weeks 0 to 15 results for the AlequelTM-treated patients. A: CD4 T cells; B: CD8 T cells; C: CD4/CD8 ratio of peripheral blood T cell populations. Black bars represent subjects who reached clinical remission (DR), while open bars represent subjects who did not reach clinical remission (DNOR). The evaluable number of patients in each group was too small to reach a statistical significance.
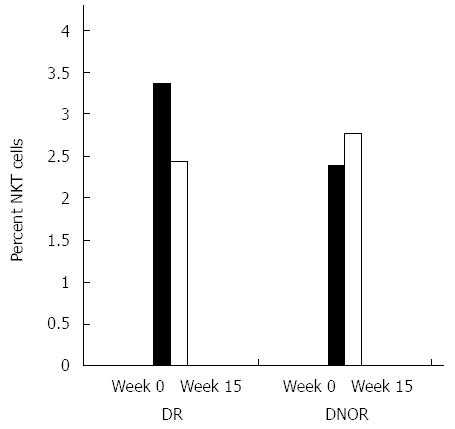
Figure 3 Effect of oral administration of AlequelTM on peripheral natural killer T cells.
Flow cytometry analysis analysis of the peripheral natural killer T (NKT) lymphocyte subset was performed. Black bars represent subjects who reached clinical remission (DR), while open bars represent subjects who did not reach clinical remission (DNOR).
- Citation: Israeli E, Zigmond E, Lalazar G, Klein A, Hemed N, Goldin E, Ilan Y. Oral mixture of autologous colon-extracted proteins for the Crohn’s disease: A double-blind trial. World J Gastroenterol 2015; 21(18): 5685-5694
- URL: https://www.wjgnet.com/1007-9327/full/v21/i18/5685.htm
- DOI: https://dx.doi.org/10.3748/wjg.v21.i18.5685


