Copyright
©The Author(s) 2015.
World J Gastroenterol. Apr 28, 2015; 21(16): 4840-4851
Published online Apr 28, 2015. doi: 10.3748/wjg.v21.i16.4840
Published online Apr 28, 2015. doi: 10.3748/wjg.v21.i16.4840
Figure 1 Double immunofluorescence labeling of cystathionine β-synthase and cystathionine γ-lyase proteins in cultured mouse gastric smooth muscle cells.
A: CBS-IR is present in α-actin IR smooth muscle cells; B: CSE-IR is present in α-actin IR smooth muscle cells; C: Negative control without primary antibodies (scale bar =100 μm). CBS: Cystathionine β-synthase; CSE: Cystathionine γ-lyase; IR: Immunoreactivity.
Figure 2 Effect of H2S on the tension of gastric smooth muscle.
A: Different doses of NaHS significantly enhanced the gastric fundus smooth muscle tension (a: Representative trace of changes in gastric fundus smooth muscle tension induced by different concentrations of NaHS; b: Summarized graph showing the effects of different concentrations of NaHS in inducing basal tension); B: Effects of endogenous H2S on the gastric fundus smooth muscle tension (a: Representative traces of AOAA- and L-NAME-induced basal tension; b: Summarized graph showing the changes in AOAA and L-NAME-induced tonic contraction). Data are expressed as mean ± SE, n = 10, aP < 0.05, vs the control. AOAA: Aminooxyacetic acid; L-NAME: Nω-nitro-L-arginine methyl.
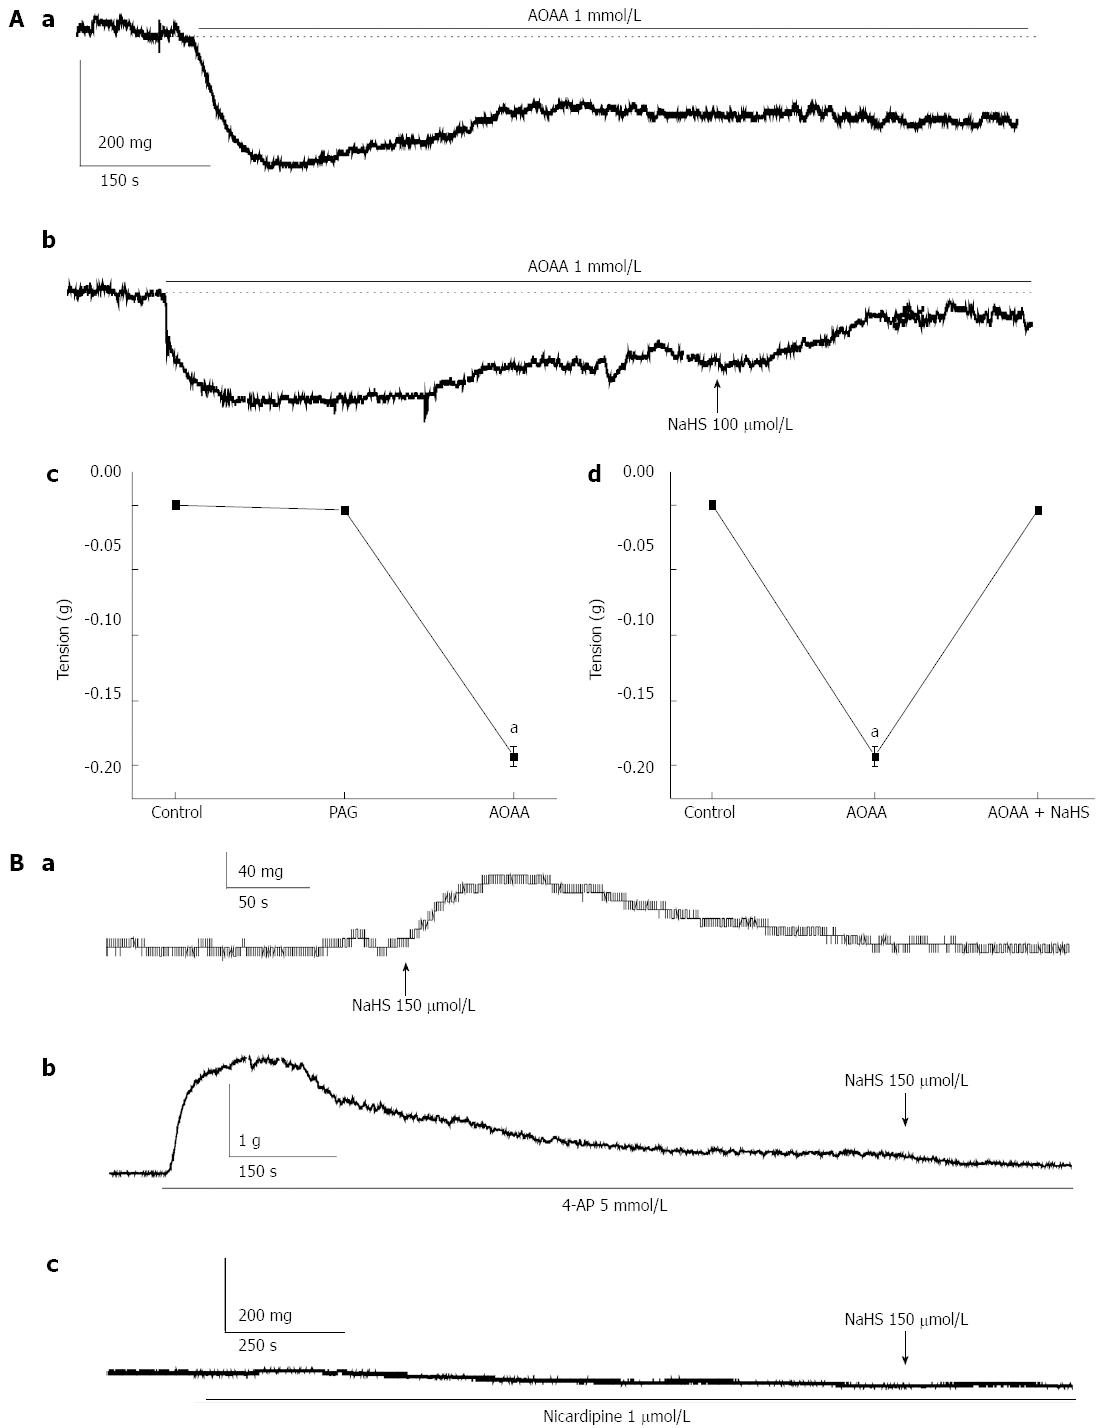
Figure 3 Effects of aminooxyacetic acid, DL-propargylglycine and ion channel blockers on NaHS-induced gastric fundus smooth muscle tonic contraction.
A: Effects of AOAA and PAG on gastric fundus smooth muscle basal tension (a, b: H2S significantly recovered the AOAA-induced decrease in basal tension; c: Summarized graph showing the changes in AOAA- and PAG-induced tonic contractions; d: The recovery effect of NaHS on the AOAA-induced decrease in gastric fundus smooth muscle tension); B: Effects of a potassium channel blocker and L-type calcium channel blocker on NaHS-induced tonic contraction (a: Representative traces of NaHS-induced tonic contraction; b,c: Effect of 4-AP (5 mmol/L) on NaHS-induced tonic contraction, and effect of nicardipine (1μmol/L) on NaHS-induced tonic contraction. Data are expressed as mean ± SE, n = 10, aP < 0.05, vs the control. AOAA: Aminooxyacetic acid; PAG: DL-propargylglycine.
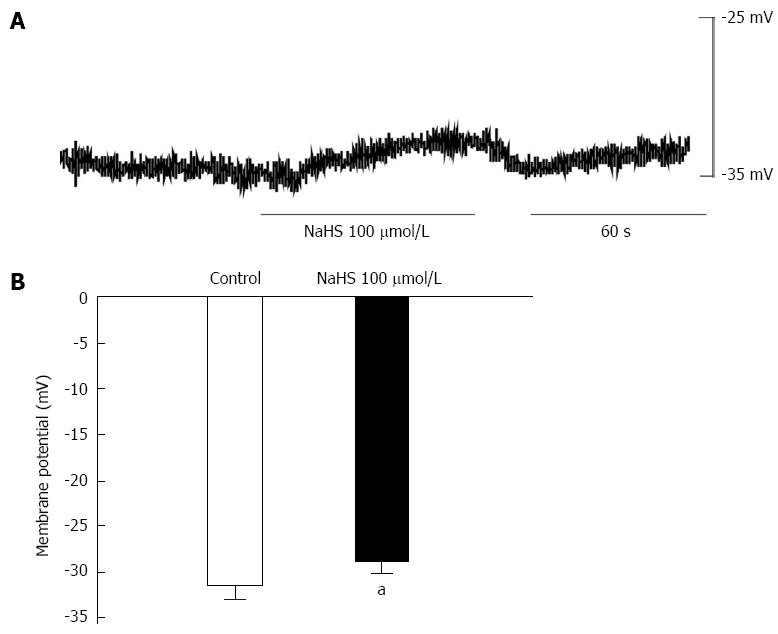
Figure 4 Effect of NaHS on the membrane potential of the gastric fundus smooth muscle.
A: Raw trace of the NaHS-induced change in membrane potential; B: Summarized graph showing the change in the NaHS-induced increase in the membrane potential. Data are expressed as mean ± SE, n = 6, aP < 0.05 vs the control.
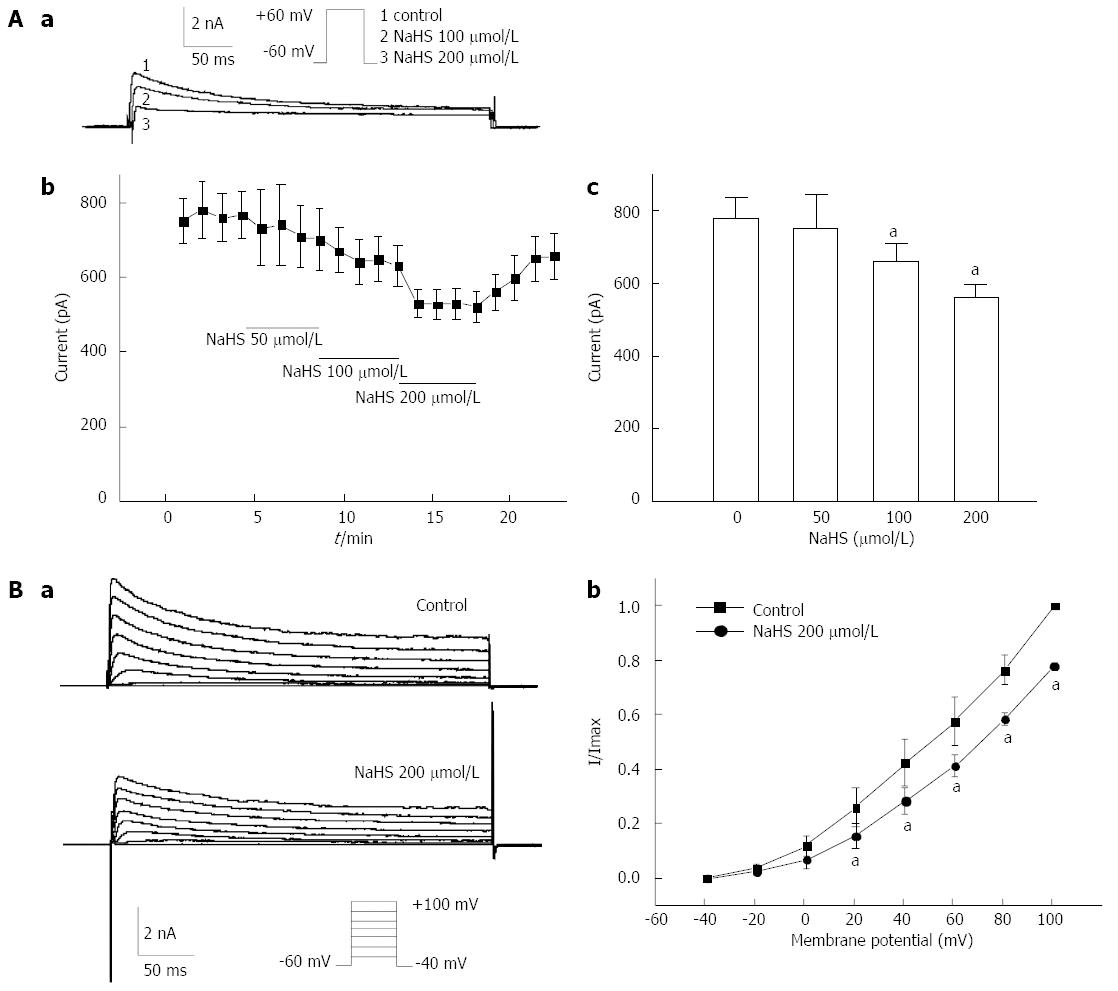
Figure 5 Effects of NaHS on IKv in gastric fundus smooth muscle cells.
Aa: Representative traces elicited by a single depolarized step pulse; Ab: The time-dependent effect of different concentrations of NaHS on IKv; Ac: Summarized graph showing the changes in the NaHS-induced inhibition of IKv elicited by a single depolarized step pulse; Ba: Representative traces of the NaHS-induced decrease in IKv in gastric smooth muscle cells; Bb: The I-V relation curve of the NaHS-induced change in IKv. Data are expressed as mean ± SE, n = 6, aP < 0.05 vs the control.
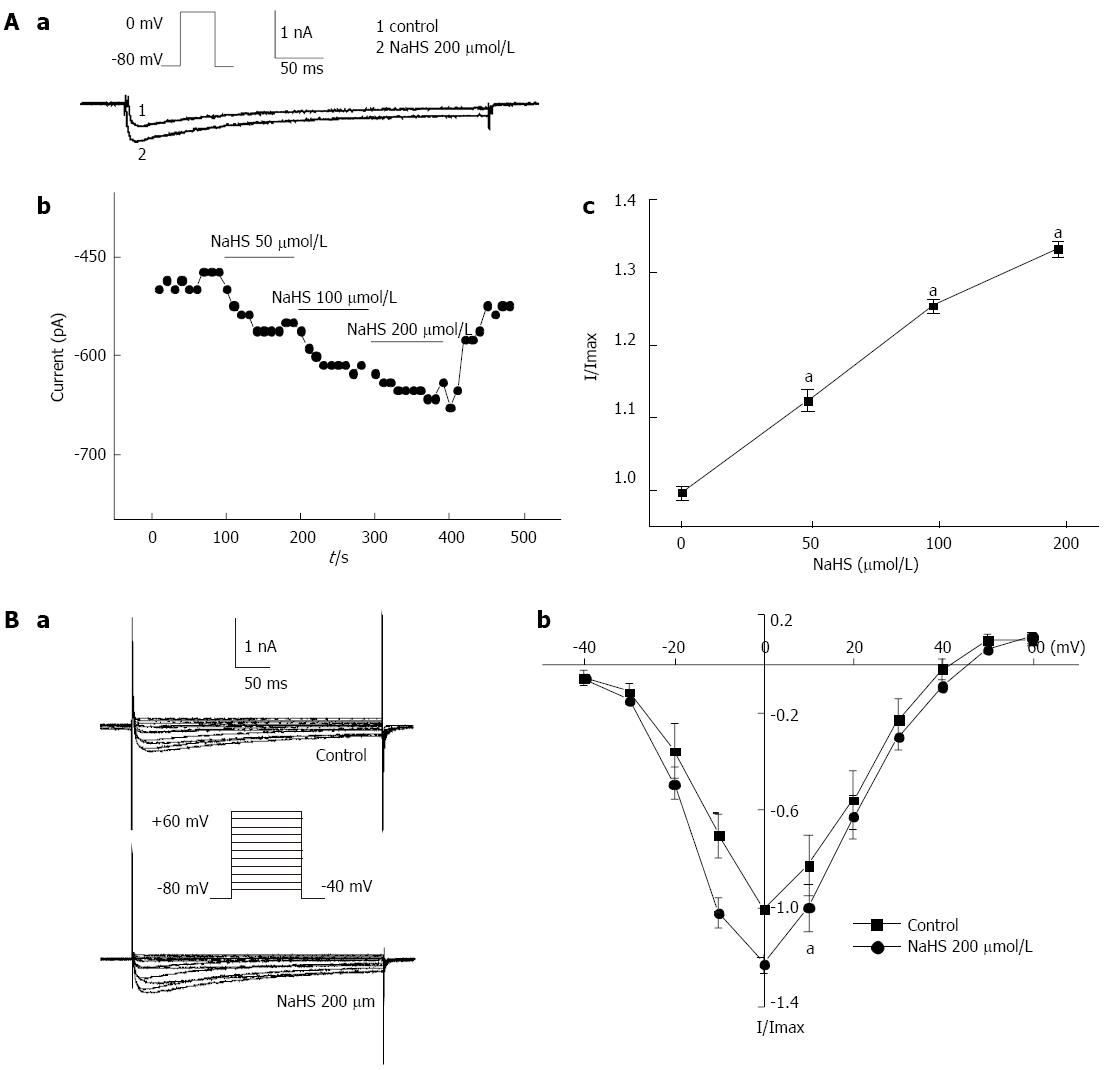
Figure 6 Effects of NaHS on ICa in gastric fundus smooth muscle cells.
Aa: Representative traces elicited by a single depolarized step pulse; Ab: The time-dependent effect of different concentrations of NaHS on ICa; Ac: Summarized graph showing the change in the NaHS-induced inhibition of ICa elicited by a single depolarized step pulse; Ba: Representative traces of the NaHS-induced increase in ICa in gastric smooth muscle cells; Bb: The I-V relation curve of the NaHS-induced change in ICa. Data are expressed as mean ± SE, n = 6, aP < 0.05 vs the control.
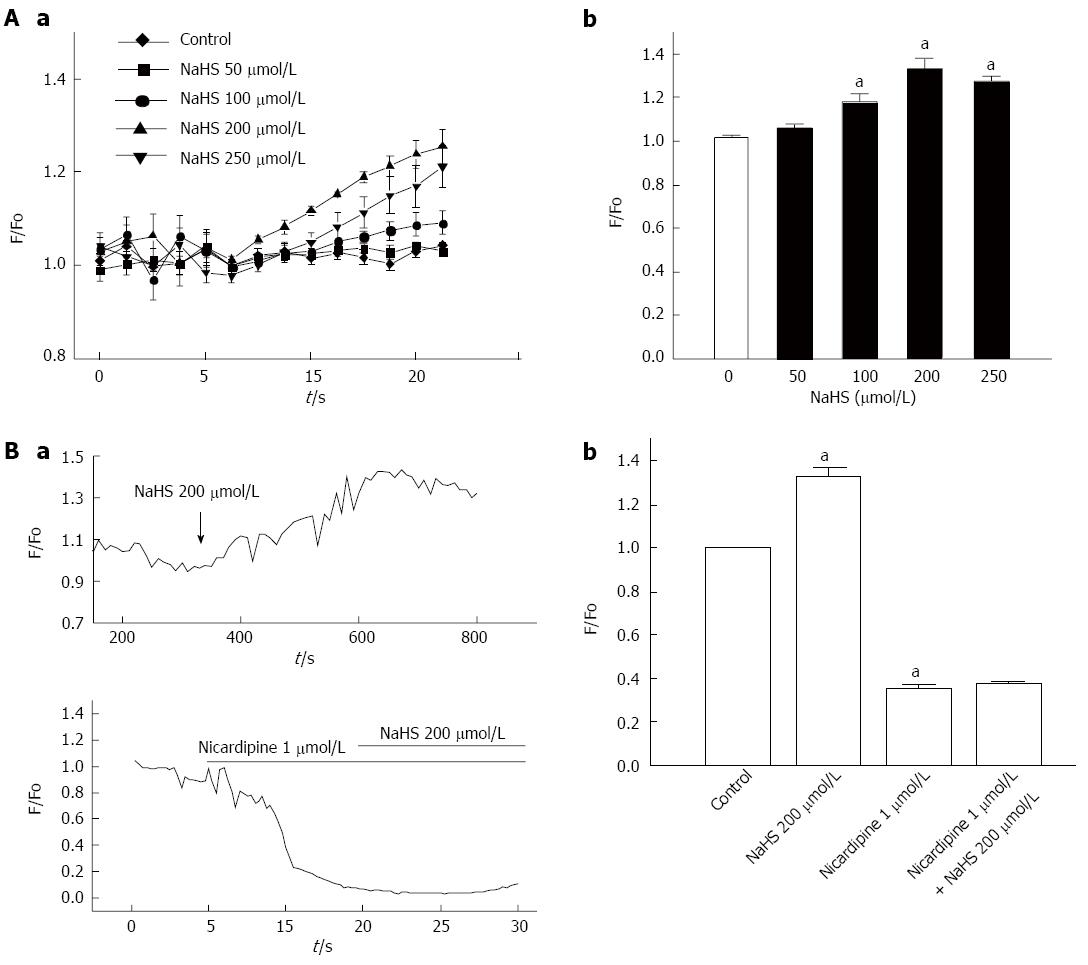
Figure 7 Effect of NaHS on [Ca2+]i in cultured gastric fundus smooth muscles.
Aa: The time-dependent effects of different concentrations of NaHS on [Ca2+]i. Ab: Summary graph showing the effects of the NaHS-induced increase in intracellular calcium; Ba: Raw traces of the NaHS-induced increase in intracellular calcium. Representative traces showing the effect of nicardipine on the H2S-induced increase in intracellular calcium; Bb: Summary graph showing the effects of nicardipine on the H2S-induced increase in intracellular calcium in the presence of nicardipine. Data are expressed as mean ± SE, n = 6, aP < 0.05 vs the control.
- Citation: Meng XM, Huang X, Zhang CM, Liu DH, Lu HL, Kim YC, Xu WX. Hydrogen sulfide-induced enhancement of gastric fundus smooth muscle tone is mediated by voltage-dependent potassium and calcium channels in mice. World J Gastroenterol 2015; 21(16): 4840-4851
- URL: https://www.wjgnet.com/1007-9327/full/v21/i16/4840.htm
- DOI: https://dx.doi.org/10.3748/wjg.v21.i16.4840


