Copyright
©The Author(s) 2015.
World J Gastroenterol. Apr 28, 2015; 21(16): 4840-4851
Published online Apr 28, 2015. doi: 10.3748/wjg.v21.i16.4840
Published online Apr 28, 2015. doi: 10.3748/wjg.v21.i16.4840
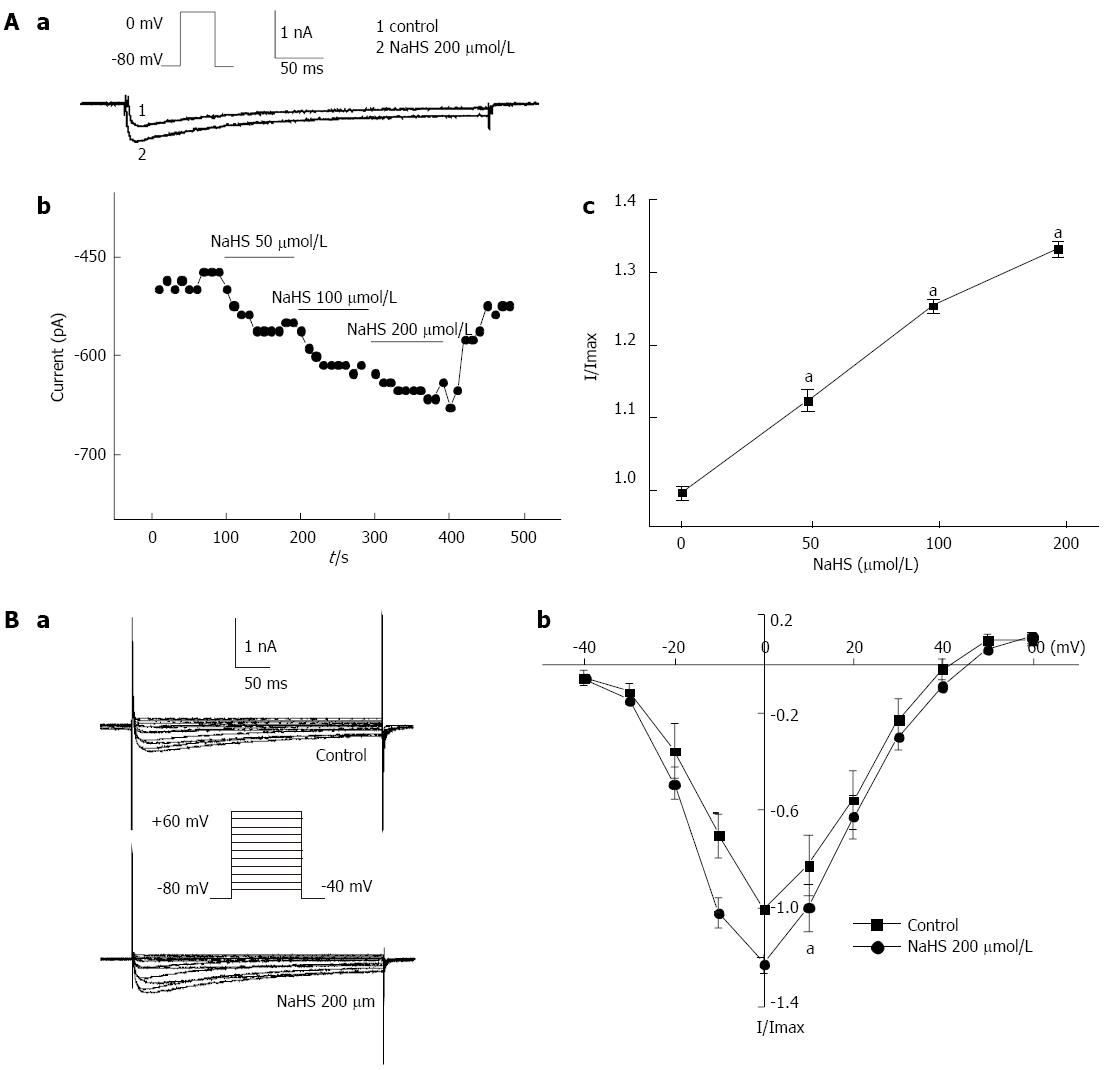
Figure 6 Effects of NaHS on ICa in gastric fundus smooth muscle cells.
Aa: Representative traces elicited by a single depolarized step pulse; Ab: The time-dependent effect of different concentrations of NaHS on ICa; Ac: Summarized graph showing the change in the NaHS-induced inhibition of ICa elicited by a single depolarized step pulse; Ba: Representative traces of the NaHS-induced increase in ICa in gastric smooth muscle cells; Bb: The I-V relation curve of the NaHS-induced change in ICa. Data are expressed as mean ± SE, n = 6, aP < 0.05 vs the control.
- Citation: Meng XM, Huang X, Zhang CM, Liu DH, Lu HL, Kim YC, Xu WX. Hydrogen sulfide-induced enhancement of gastric fundus smooth muscle tone is mediated by voltage-dependent potassium and calcium channels in mice. World J Gastroenterol 2015; 21(16): 4840-4851
- URL: https://www.wjgnet.com/1007-9327/full/v21/i16/4840.htm
- DOI: https://dx.doi.org/10.3748/wjg.v21.i16.4840


