Copyright
©The Author(s) 2015.
World J Gastroenterol. Apr 14, 2015; 21(14): 4184-4194
Published online Apr 14, 2015. doi: 10.3748/wjg.v21.i14.4184
Published online Apr 14, 2015. doi: 10.3748/wjg.v21.i14.4184
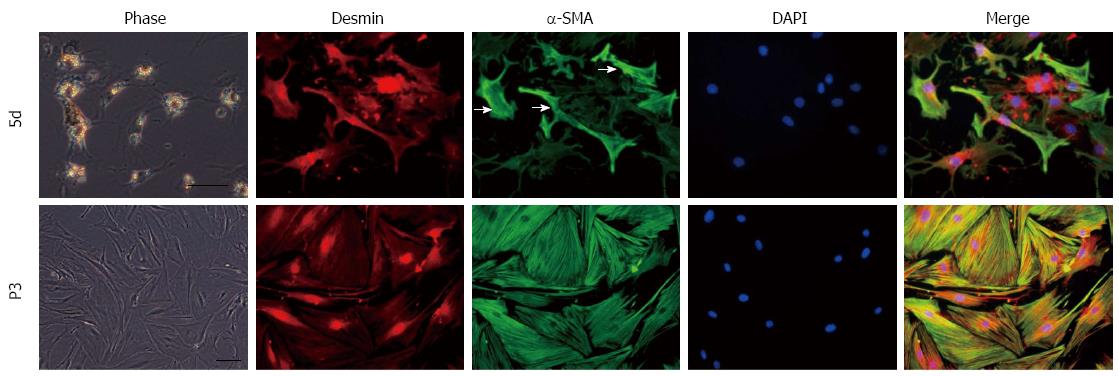
Figure 1 Morphological features and α-SMA expression of cultured hepatic stellate cells during the activation process.
Primary hepatic stellate cells (HSCs) were maintained on uncoated plastic dishes. HSCs presented a star-shaped appearance with fewer and smaller lipid droplets in the cytoplasm after primary culture for five days, and began to express α-SMA at non-uniform levels between cells. Subcultured HSCs evolved into myofibroblast-like cells without lipid droplets in the cytoplasm and expressed a uniform and higher level of α-SMA. Red: desmin; green: α-SMA; blue: nucleus (DAPI). Merged images are also shown. White arrows point to HSCs expressing high level of α-SMA. Bar = 100 μm.
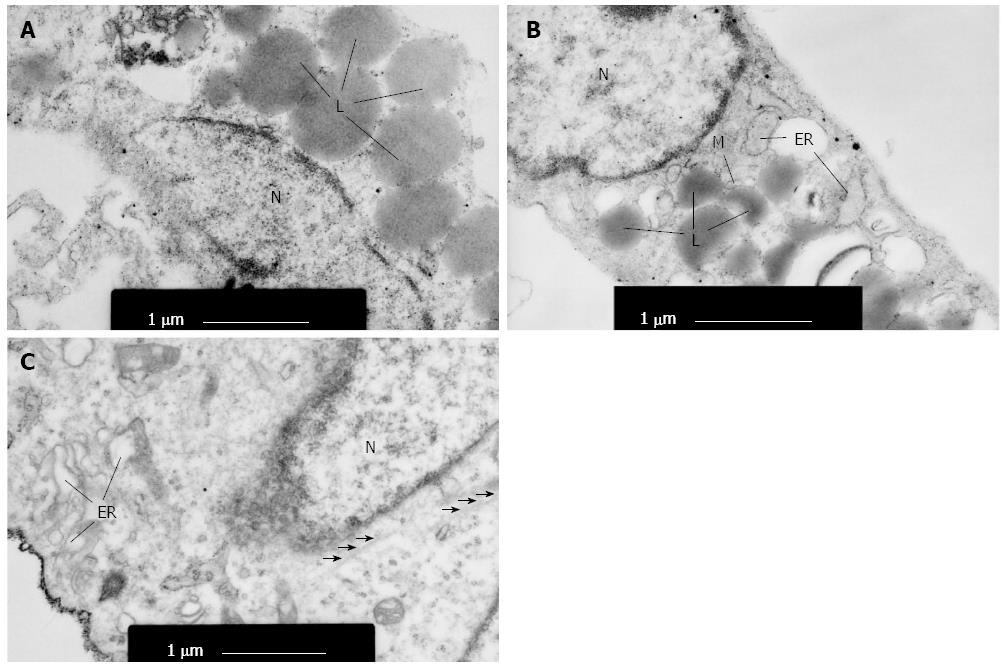
Figure 2 Ultrastructure of hepatic stellate cells observed under a transmission electron microscope.
A: HSCs contained lipid droplets (L) around the nucleus (N) after primarily cultured for 24 h; B: Primary HSCs were characterized by decreased lipid droplets and a moderate amount of rough endoplasmic reticulum (ER) and mitochondria (M) when cultured for 5 d; C: HSCs (P3) exhibited marked hypertrophy of rough endoplasmic reticulum and microfilaments, but no lipid droplets. Black arrows point to microfilaments. HSC: Hepatic stellate cell.
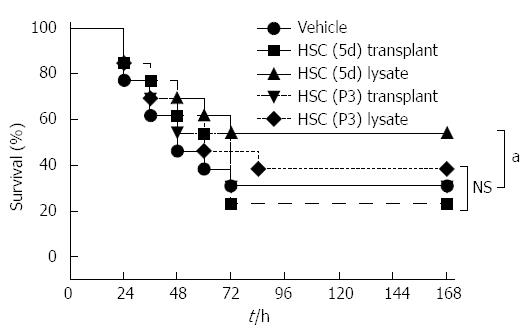
Figure 3 Infusion of hepatic stellate cell lysate provides a trend toward increased survival in acetaminophen-induced acute liver injury.
All animals were fasted overnight before acetaminophen (APAP) treatment. Mice administered APAP were treated by intravenous injection of hepatic stellate cells (HSCs) or HSC lysates from the same cell mass (0.2 mL, about 2 × 10⁶ cells). Control mice received vehicle (0.2 mL, high-glucose DMEM). Kaplan-Meier survival analysis of APAP-administered mice treated with cell transplants or lysates is performed. Time points of interventions are stated above survival plots. The results are cumulative data of two independent experiments (n = 13 per group) using different batches of HSCs. The number of death mice during survival analysis in each group: 9 in vehicle, 10 in HSC (5d) transplant, 6 in HSC (5d) lysate, 9 in HSC (P3) transplant, and 8 in HSC (P3) lysate. P-values were determined by the Kaplan-Meier analysis. aP < 0.05 vs control. NS: Not significant.
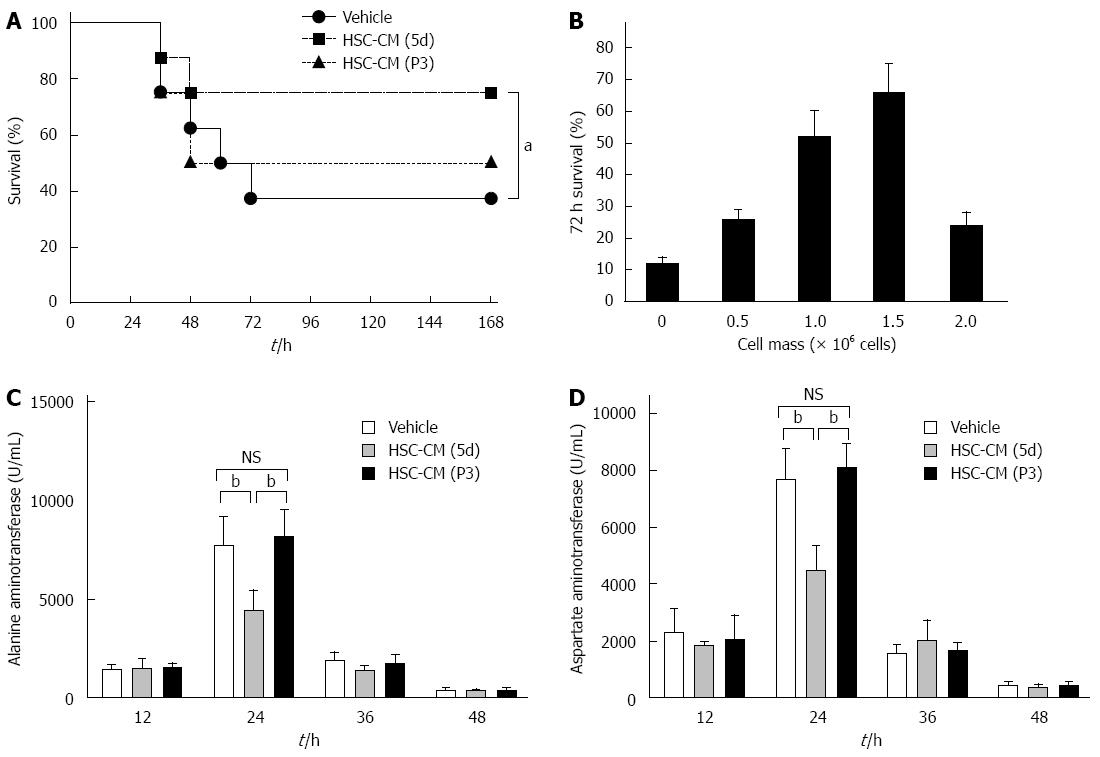
Figure 4 Hepatic stellate cell-CM (5d) provides a survival benefit in acute liver injury mice and reverses acute liver injury in a cell mass-dependent manner.
A: Kaplan-Meier survival analysis of acetaminophen (APAP)-administered mice treated with concentrated hepatic stellate cell (HSC)-CM (0.2 mL, conditioned medium of 2 × 10⁶ cells HSCs). Control mice received vehicle (0.2 mL, high-glucose DMEM). The results for both panels are cumulative data of two independent experiments (n = 13 per group). The number of death mice during survival analysis in each group: 9 in vehicle, 3 in HSC (5d), and 7 in HSC (P3). P-values were determined by the Kaplan-Meier analysis, aP < 0.05 vs control; B: Dose-response graph of animal survival 72 h after acute liver injury (ALI) induction as a function of the mass of HSCs (5d) from which HSC-CM was derived; alanine aminotransferase (C), aspartate aminotransferase levels (D) in peripheral blood samples collected at 12, 24, 36, and 48 h after the systemic treatment. bP < 0.01 vs control. NS: No significant.
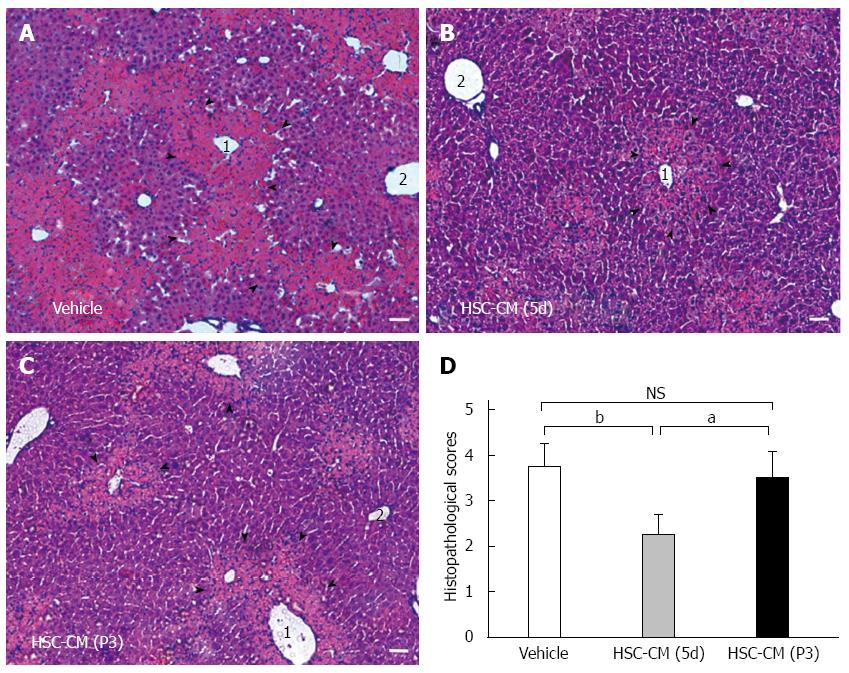
Figure 5 Hepatic stellate cell-CM (5d) treatment improves hepatocellular necrosis and immune cell infiltration in APAP-injured liver tissue.
All animals were fasted overnight before APAP treatment. Acute liver injury (ALI) mice were sacrificed 24 h after systemic vehicle or hepatic stellate cell (HSC)-CM treatment. Liver samples were subjected to histological analysis after HE staining. Microscopic low-power fields of liver tissue are shown after vehicle (A), HSC-CM (5d) (B) and HSC-CM (P3) (C) treatment. Necrotic area is indicated by arrowheads. 1: centrilobular vein, 2: portal vein. Bar = 100 μm. Scores were determined by semi-quantitative histological examination (D). Data are the mean ± SE of the mean of 10 random high-power fields per animal. aP < 0.05, bP < 0.01 vs control. Bar = 100 μm. NS: Not significant.
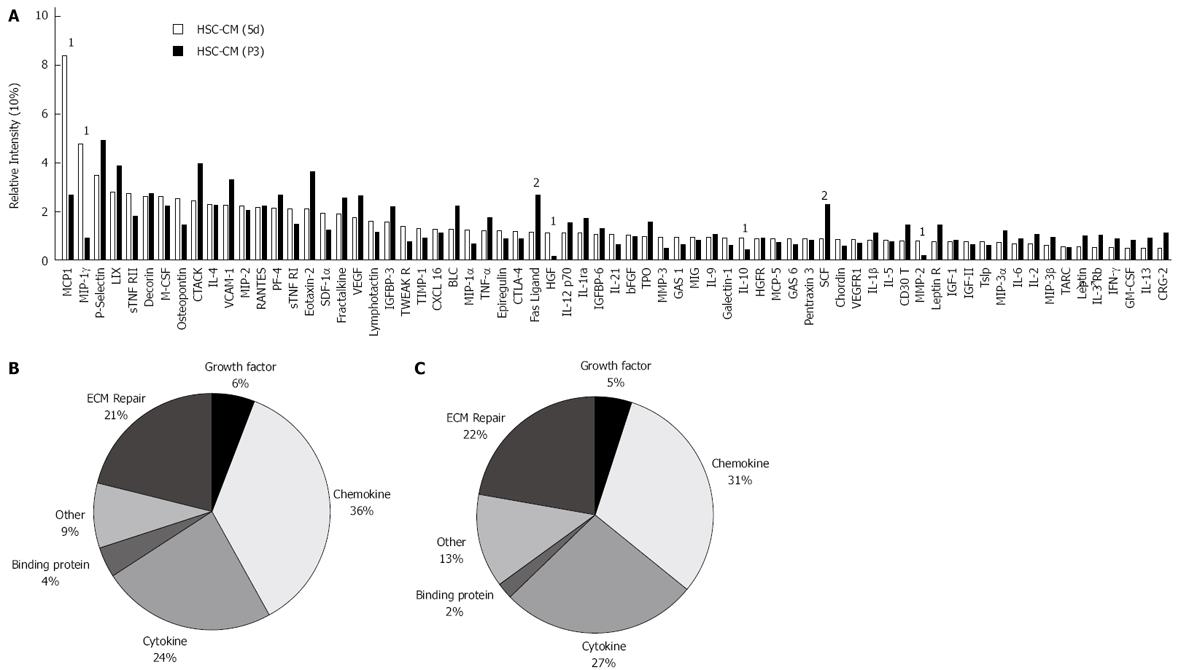
Figure 6 Differences between hepatic stellate cell-CM (5d) and hepatic stellate cell-CM (P3) in cytokine composition.
Serum-free hepatic stellate cell (HSC)-CM was analyzed using an antibody array for 144 specified proteins. A: Densitometry of spotted antibody array results. Data are presented as spot intensity relative to the negative control and normalized to the positive control. 1Molecules whose concentrations in HSC-CM (5d) were more than twice as high as in HSC-CM (P3); 2molecules whose concentrations in HSC-CM (P3) were more than twice as high as in HSC-CM (5d). Pie chart showing cluster analysis of HSC (5d) secreted proteins (B) and HSC (P3) secreted proteins (C) based on reported function.
- Citation: Chang WJ, Song LJ, Yi T, Shen KT, Wang HS, Gao XD, Li M, Xu JM, Niu WX, Qin XY. Early activated hepatic stellate cell-derived molecules reverse acute hepatic injury. World J Gastroenterol 2015; 21(14): 4184-4194
- URL: https://www.wjgnet.com/1007-9327/full/v21/i14/4184.htm
- DOI: https://dx.doi.org/10.3748/wjg.v21.i14.4184


