Copyright
©The Author(s) 2015.
World J Gastroenterol. Apr 14, 2015; 21(14): 4184-4194
Published online Apr 14, 2015. doi: 10.3748/wjg.v21.i14.4184
Published online Apr 14, 2015. doi: 10.3748/wjg.v21.i14.4184
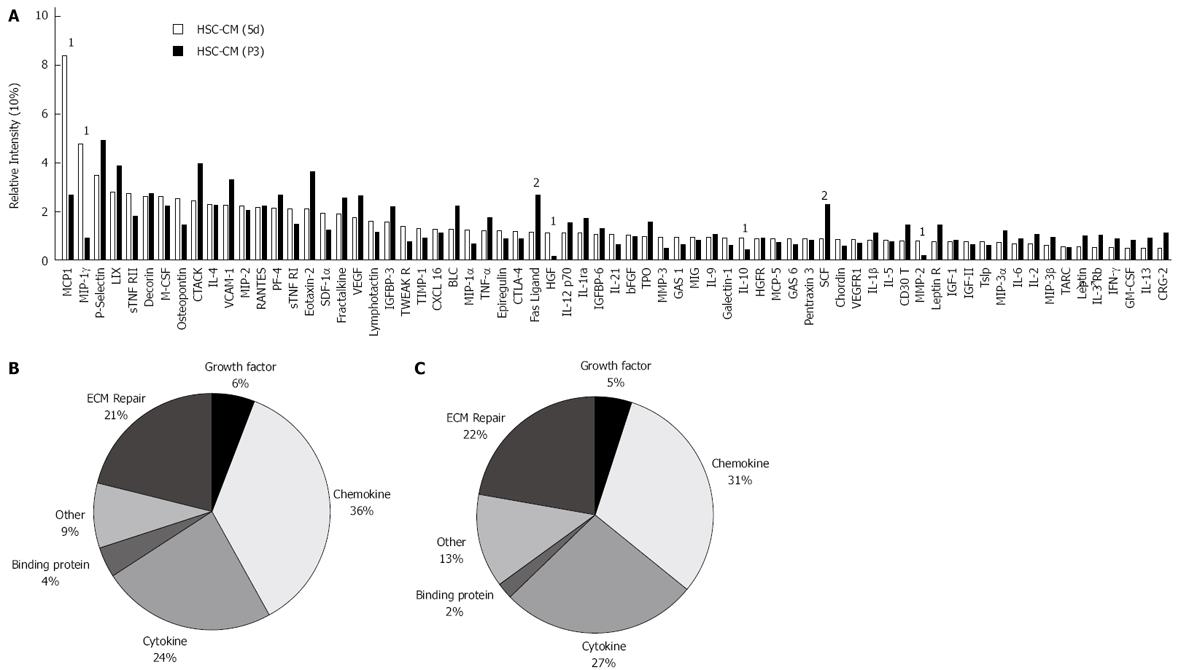
Figure 6 Differences between hepatic stellate cell-CM (5d) and hepatic stellate cell-CM (P3) in cytokine composition.
Serum-free hepatic stellate cell (HSC)-CM was analyzed using an antibody array for 144 specified proteins. A: Densitometry of spotted antibody array results. Data are presented as spot intensity relative to the negative control and normalized to the positive control. 1Molecules whose concentrations in HSC-CM (5d) were more than twice as high as in HSC-CM (P3); 2molecules whose concentrations in HSC-CM (P3) were more than twice as high as in HSC-CM (5d). Pie chart showing cluster analysis of HSC (5d) secreted proteins (B) and HSC (P3) secreted proteins (C) based on reported function.
- Citation: Chang WJ, Song LJ, Yi T, Shen KT, Wang HS, Gao XD, Li M, Xu JM, Niu WX, Qin XY. Early activated hepatic stellate cell-derived molecules reverse acute hepatic injury. World J Gastroenterol 2015; 21(14): 4184-4194
- URL: https://www.wjgnet.com/1007-9327/full/v21/i14/4184.htm
- DOI: https://dx.doi.org/10.3748/wjg.v21.i14.4184


