Copyright
©The Author(s) 2015.
World J Gastroenterol. Mar 21, 2015; 21(11): 3441-3446
Published online Mar 21, 2015. doi: 10.3748/wjg.v21.i11.3441
Published online Mar 21, 2015. doi: 10.3748/wjg.v21.i11.3441
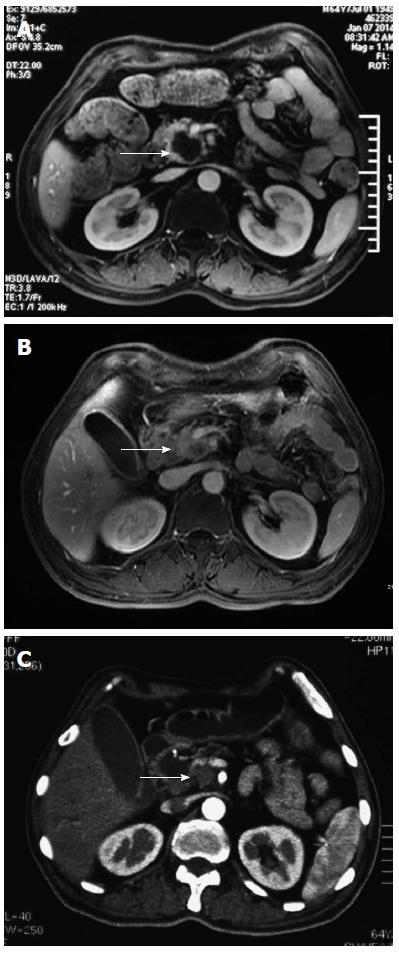
Figure 1 Contrast-enhanced magnetic resonance imaging of the pancreas.
A: Before treatment, a mass was observed (arrow) in the head of pancreas; B: Marked shrinkage of the mass was seen after two treatment cycles; C: Mass size remained stable after four treatment cycles.
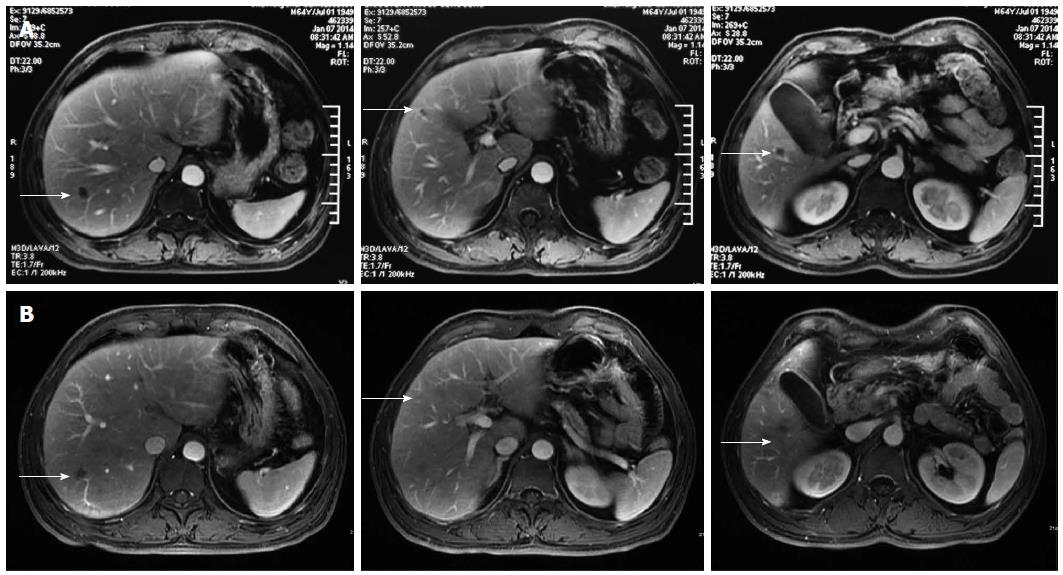
Figure 2 Contrast-enhanced magnetic resonance imaging of the liver.
A: Before treatment, multiple metastatic nodules (arrows) were observed in the liver at three different levels; B: Marked shrinkage of the nodules was seen after two treatment cycles.
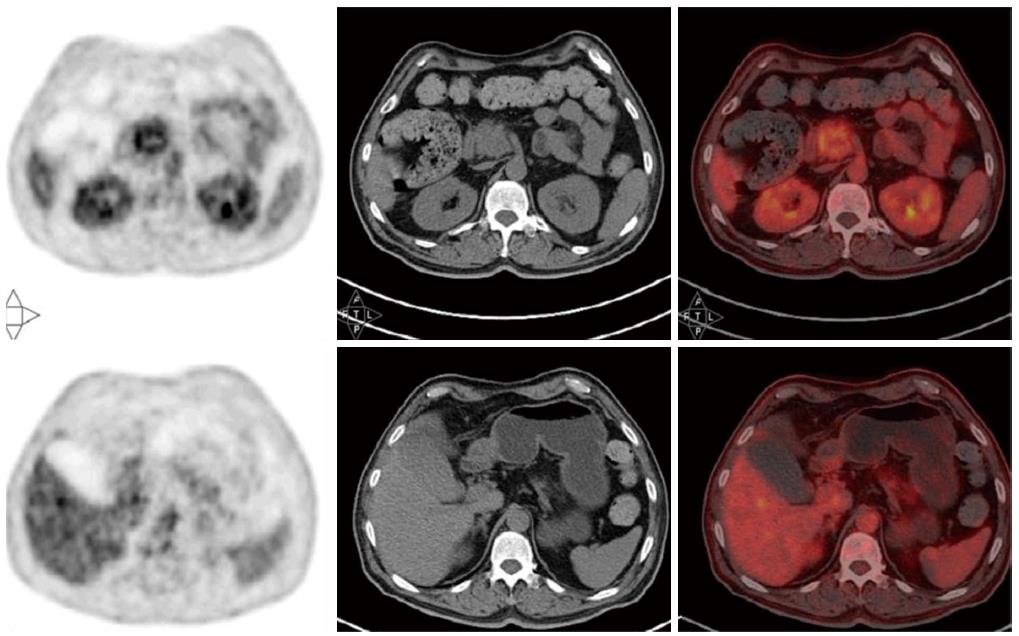
Figure 3 Positron emission tomography-computerized tomography.
Masses in the pancreas and liver were observed before treatment.
Figure 4 Cytological examination of the pancreatic mass.
Hematoxylin and eosin staining indicated the mass was an adenocarcinoma (magnification × 200).
- Citation: Zhao J, Shen H, Hu HG, Huang JJ. Icotinib plus gemcitabine for metastatic pancreatic cancer: A case report. World J Gastroenterol 2015; 21(11): 3441-3446
- URL: https://www.wjgnet.com/1007-9327/full/v21/i11/3441.htm
- DOI: https://dx.doi.org/10.3748/wjg.v21.i11.3441


