Copyright
©The Author(s) 2015.
World J Gastroenterol. Mar 21, 2015; 21(11): 3245-3255
Published online Mar 21, 2015. doi: 10.3748/wjg.v21.i11.3245
Published online Mar 21, 2015. doi: 10.3748/wjg.v21.i11.3245
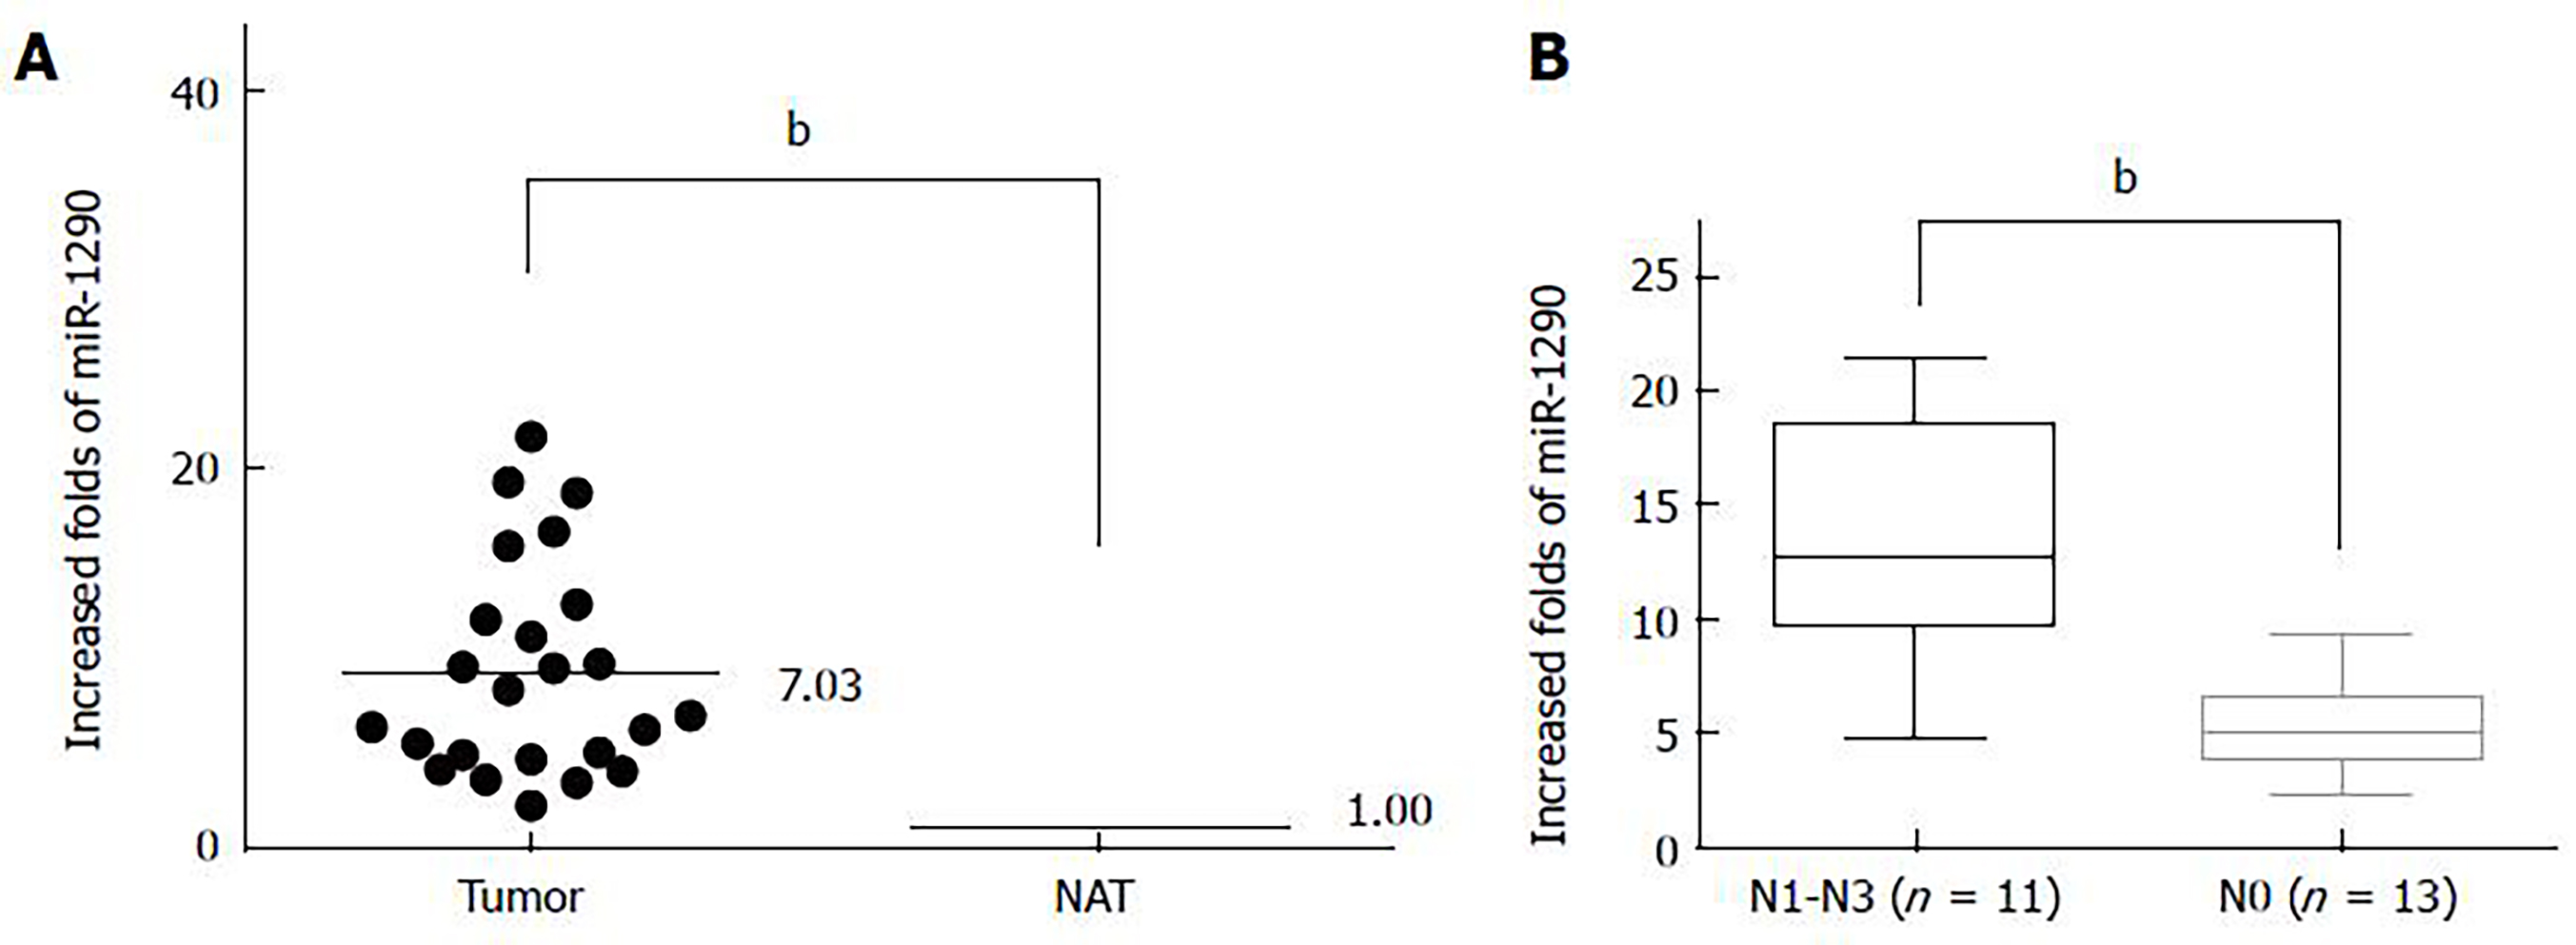
Figure 1 miR-1290 expression is upregulated in clinical specimens.
A: qRT-PCR analysis showed that miR-1290 expression was upregulated in ESCC tissues compared with paired normal adjacent tissues; B: miR-1290 expression was significantly higher in ESCC patients with lymph node metastasis compared with patients without lymph metastasis bP < 0.01 between groups. Small nuclear RNA U6 was used as a normalization control. NAT: Normal adjacent tissues; qRT-PCR: Quantitative real-time polymerase chain reaction; ESCC: Esophageal squamous cell carcinoma.
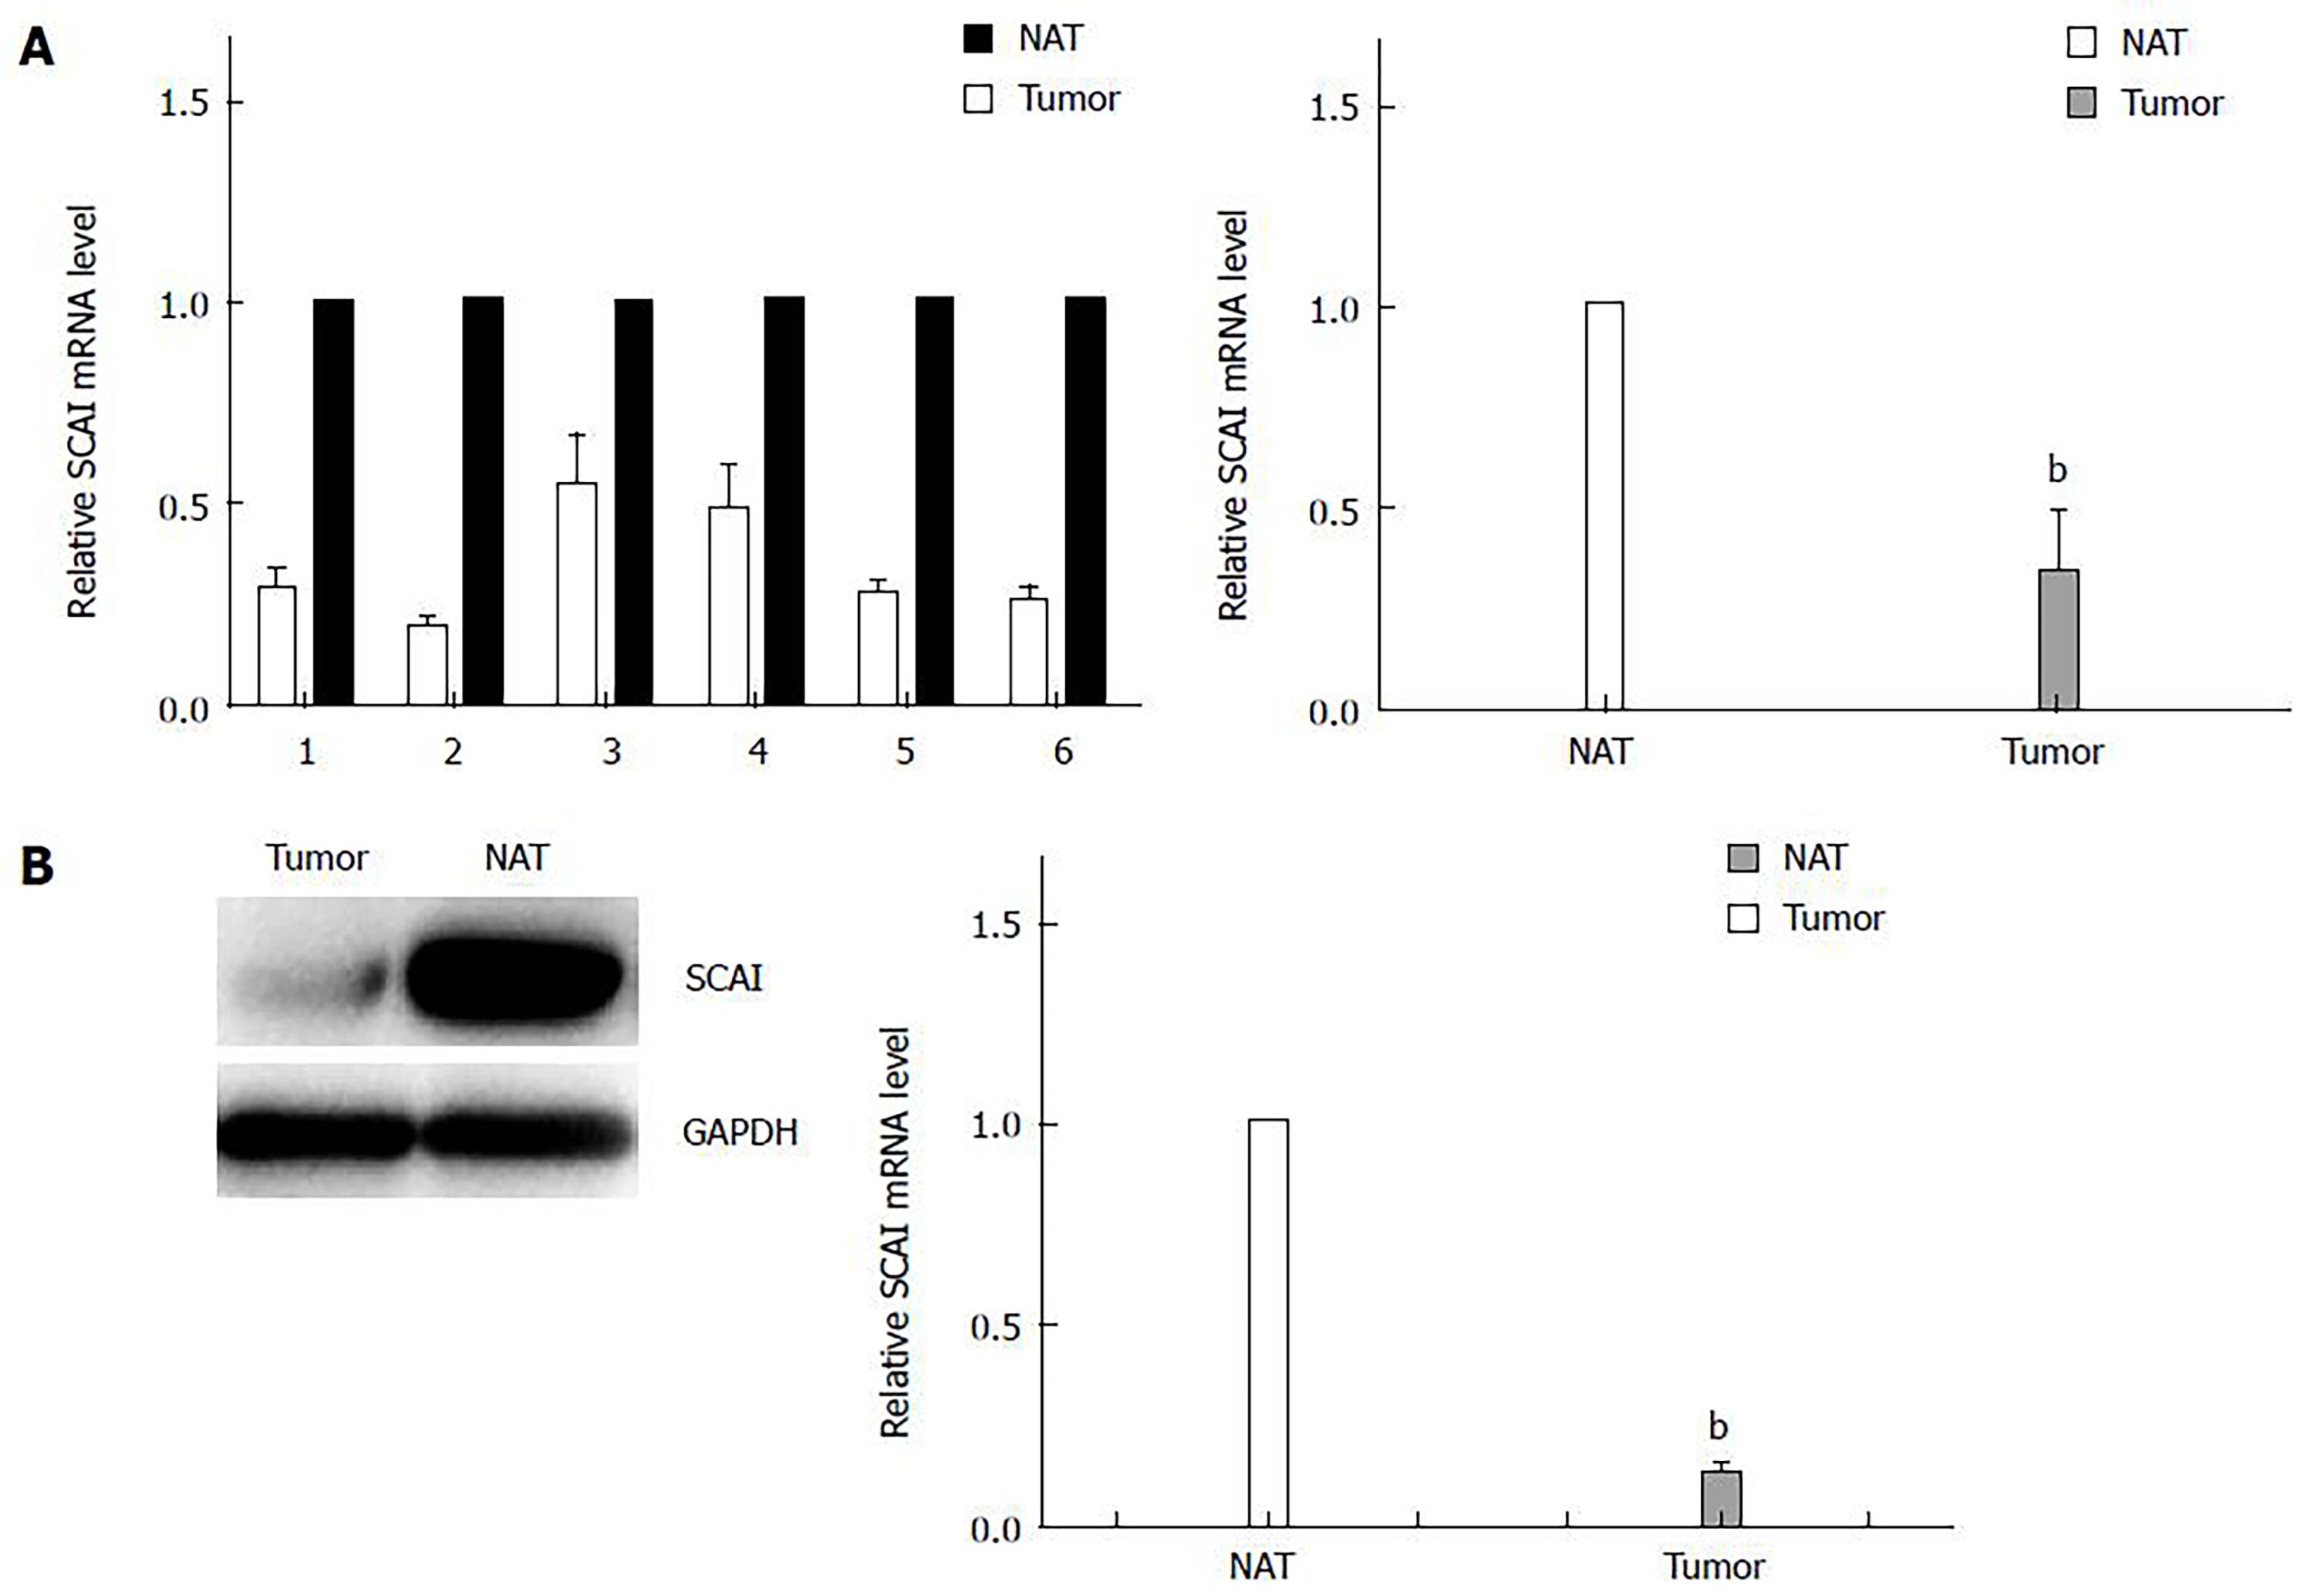
Figure 2 mRNA and protein expression of suppressor of cancer cell invasion is downregulated in clinical esophageal squamous cell carcinoma specimens.
A: Quantitative real-time PCR analysis showed that the relative mRNA expression of SCAI was downregulated in ESCC tissues compared with that in paired adjacent normal tissues, n = 6; B: Protein expression level of SCAI was significantly decreased in ESCC compared with that in paired adjacent normal tissues, n = 6. bP < 0.01 vs control. NAT: Normal adjacent tissues; SCAI: Suppressor of cancer cell invasion; PCR: Polymerase chain reaction; ESCC: Esophageal squamous cell carcinoma.
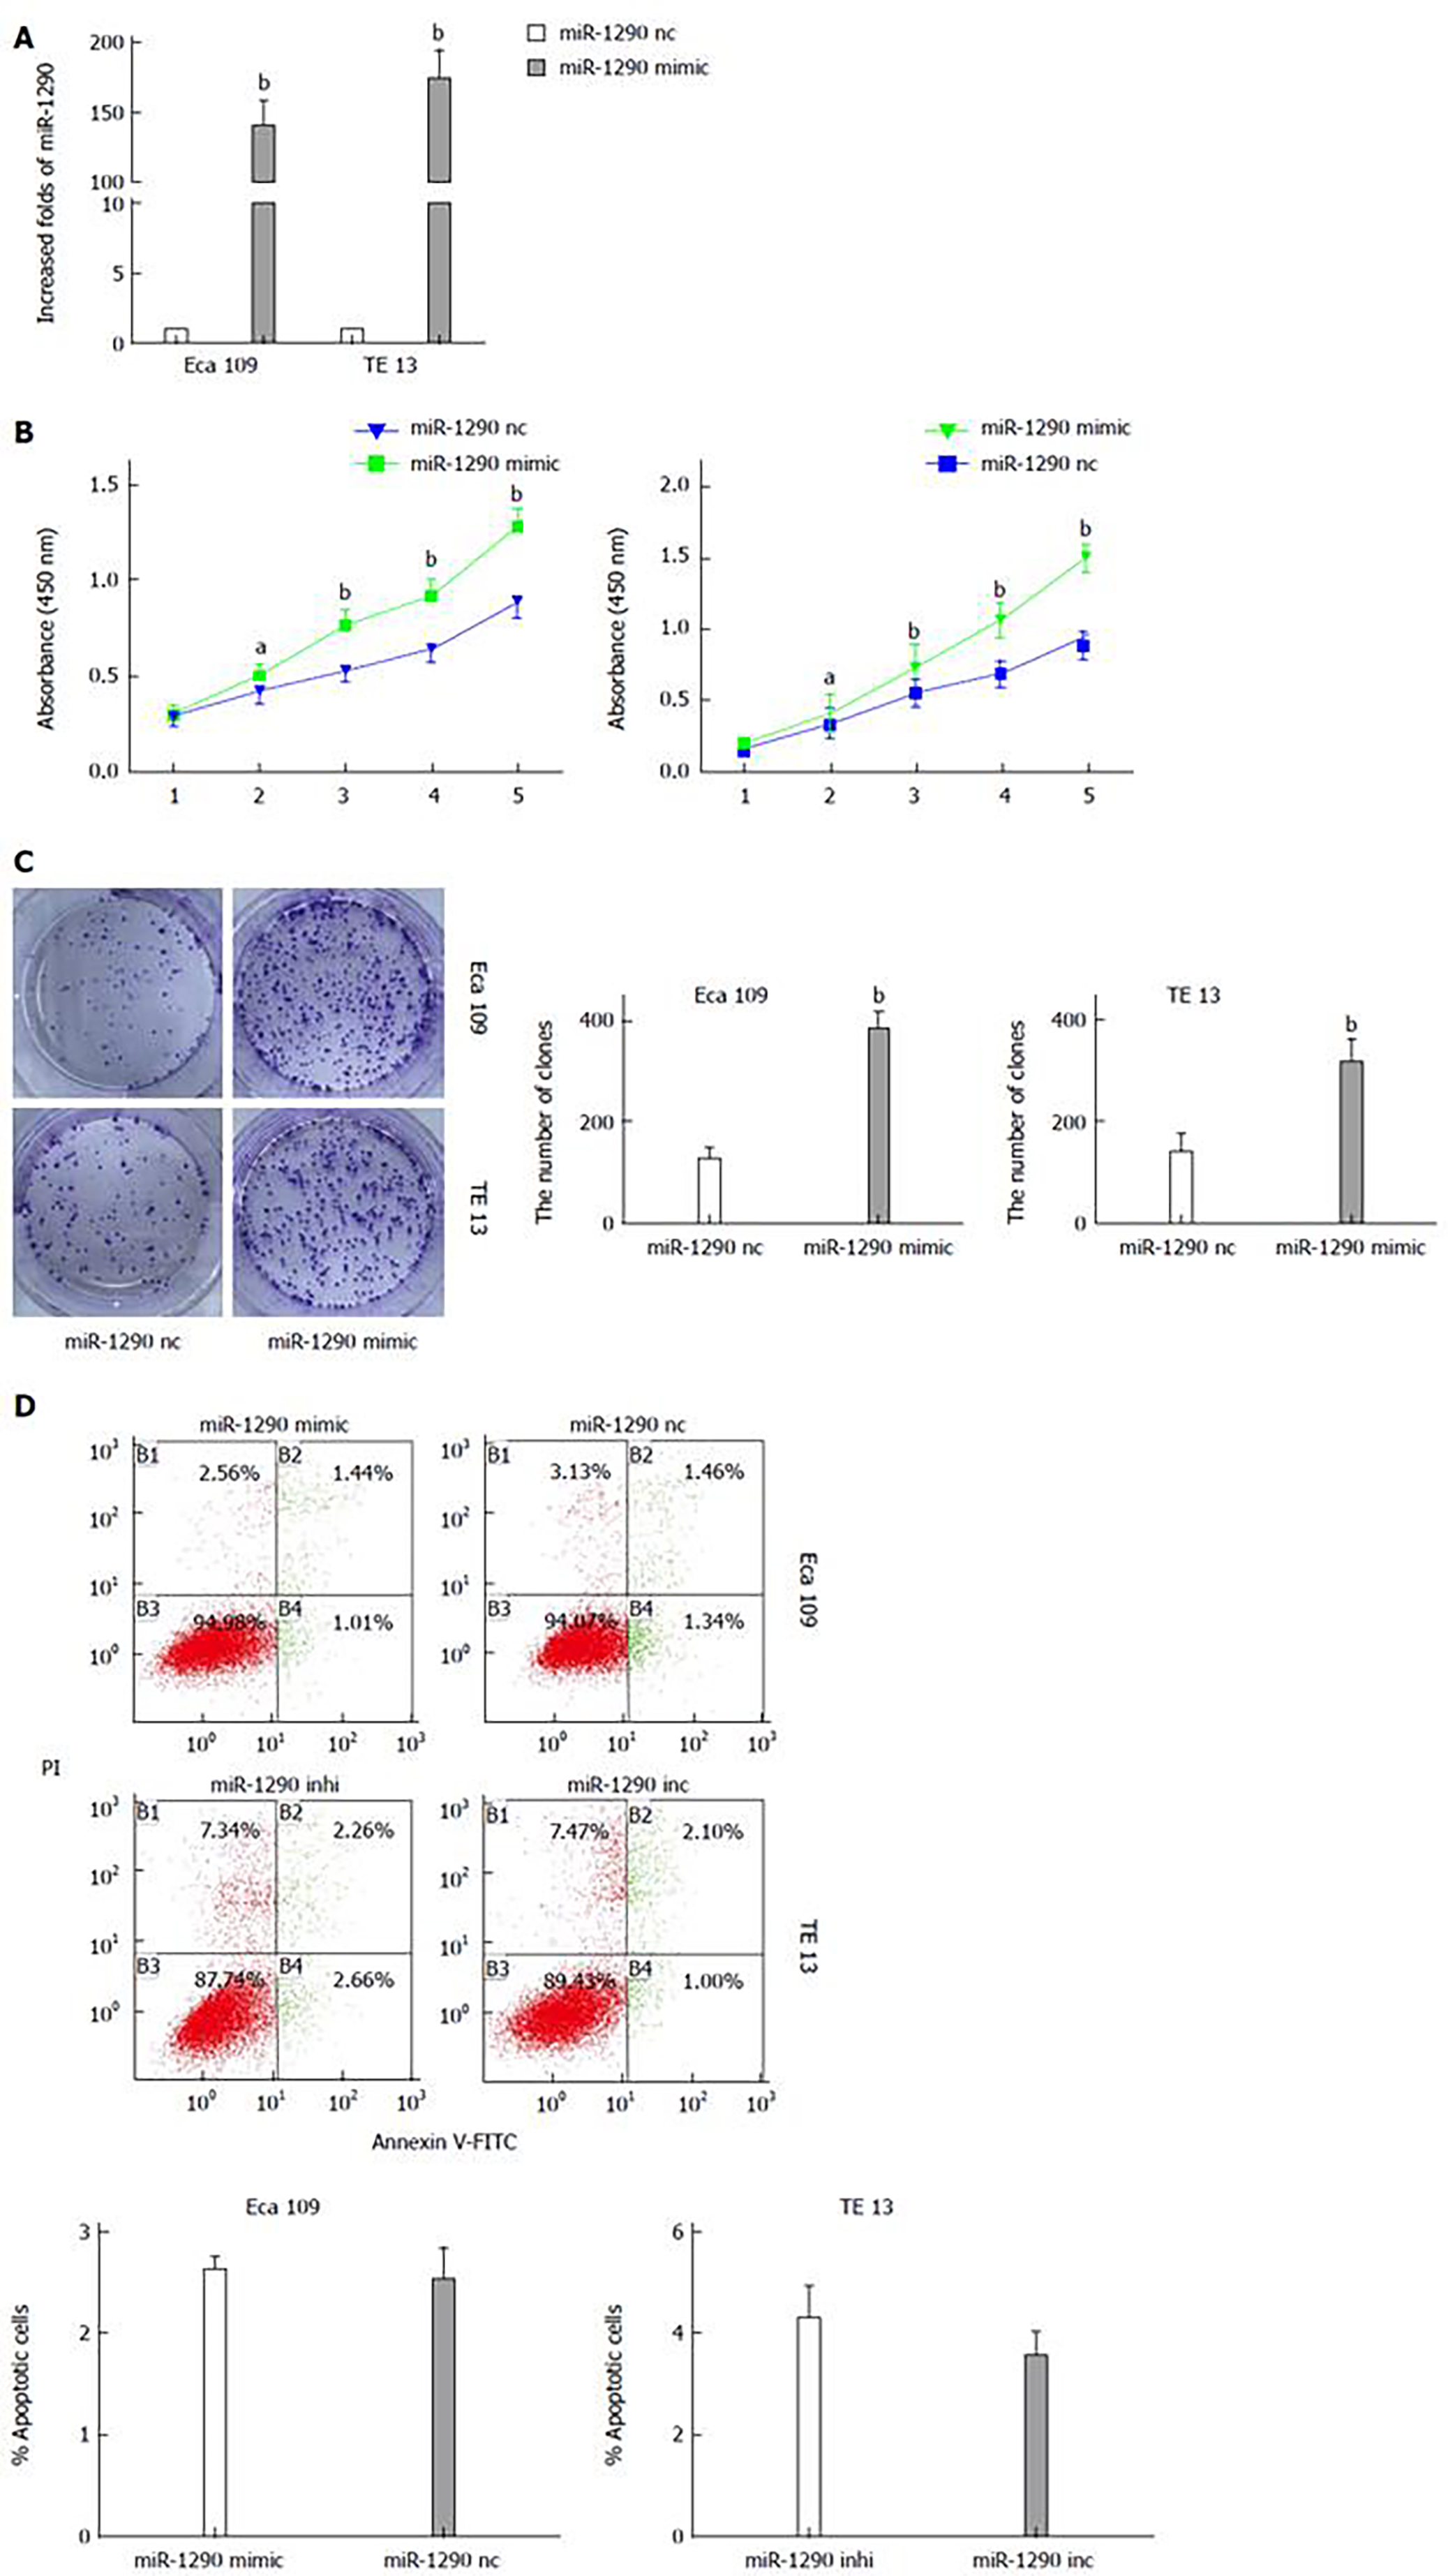
Figure 3 MiR-1290 overexpression promotes the growth of Eca109 and TE13 cells.
A: miR-1290 expression was significantly higher in cells transfected with miR-1290 mimic than in negative control cells; B: CCK8 assay showed that miR-1290 promoted Eca109 and TE13 cell proliferation; C: Colony formation assay showed that miR-1290 enriched the colony formation of Eca109 and TE13 cells; D: miR-1290 overexpression in Eca109 cells and miR-1290 under-expression in TE13 cells did not significantly alter cell apoptosis ability. bP < 0.01 vs control; aP < 0.05 vs control. nc: Negative control; inhi: Inhibitor; inc: Inhibitor negative control.
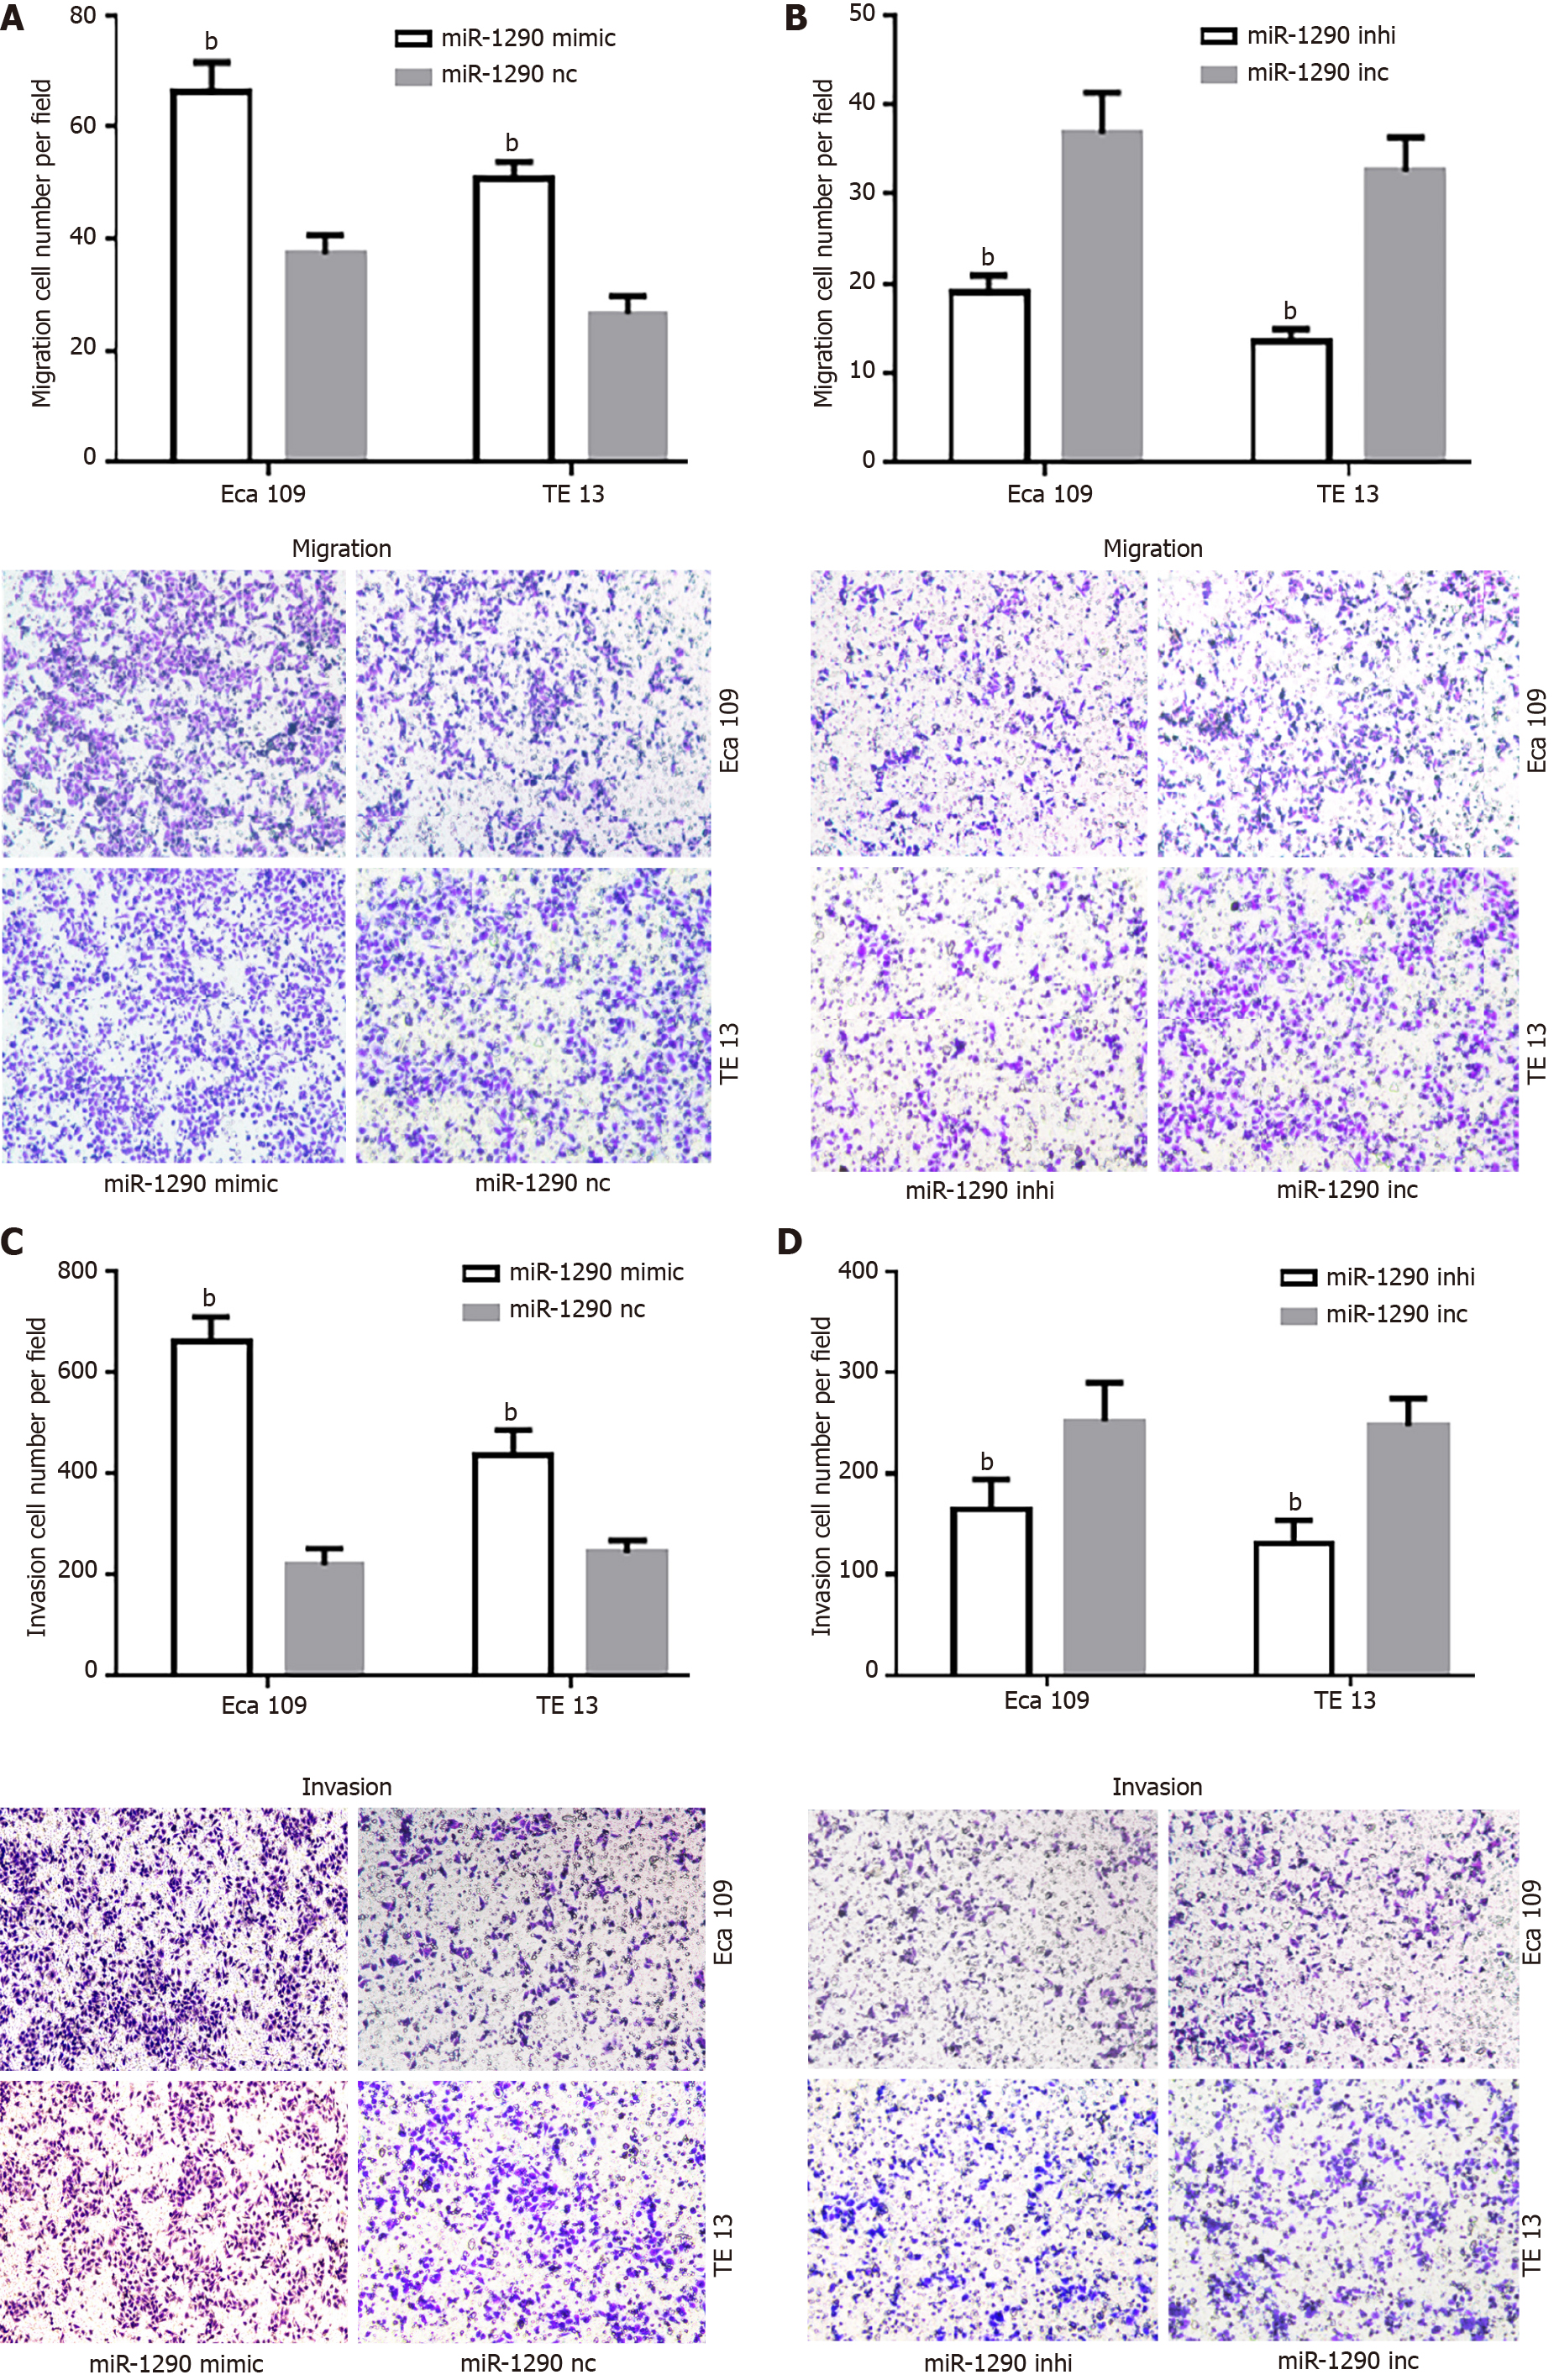
Figure 4 MiR-1290 enhances the migration and invasion of Eca109 and TE13 cells.
Transwell migration assays were carried out in Eca109 and TE13 cells transfected with either miR-1290 mimic (A) or miR-1290 inhibitor (B). Representative fields of migrating cells on the membrane are presented. The histogram shows the number of migrating cells from three independent experiments. Overexpression (C) and under-expression of miR-1290 in Eca109 and TE13 cells (D) showed similar results in both invasion and migration assays. bP < 0.01 vs control. nc: Negative control; inhi: Inhibitor; inc: Inhibitor negative control.
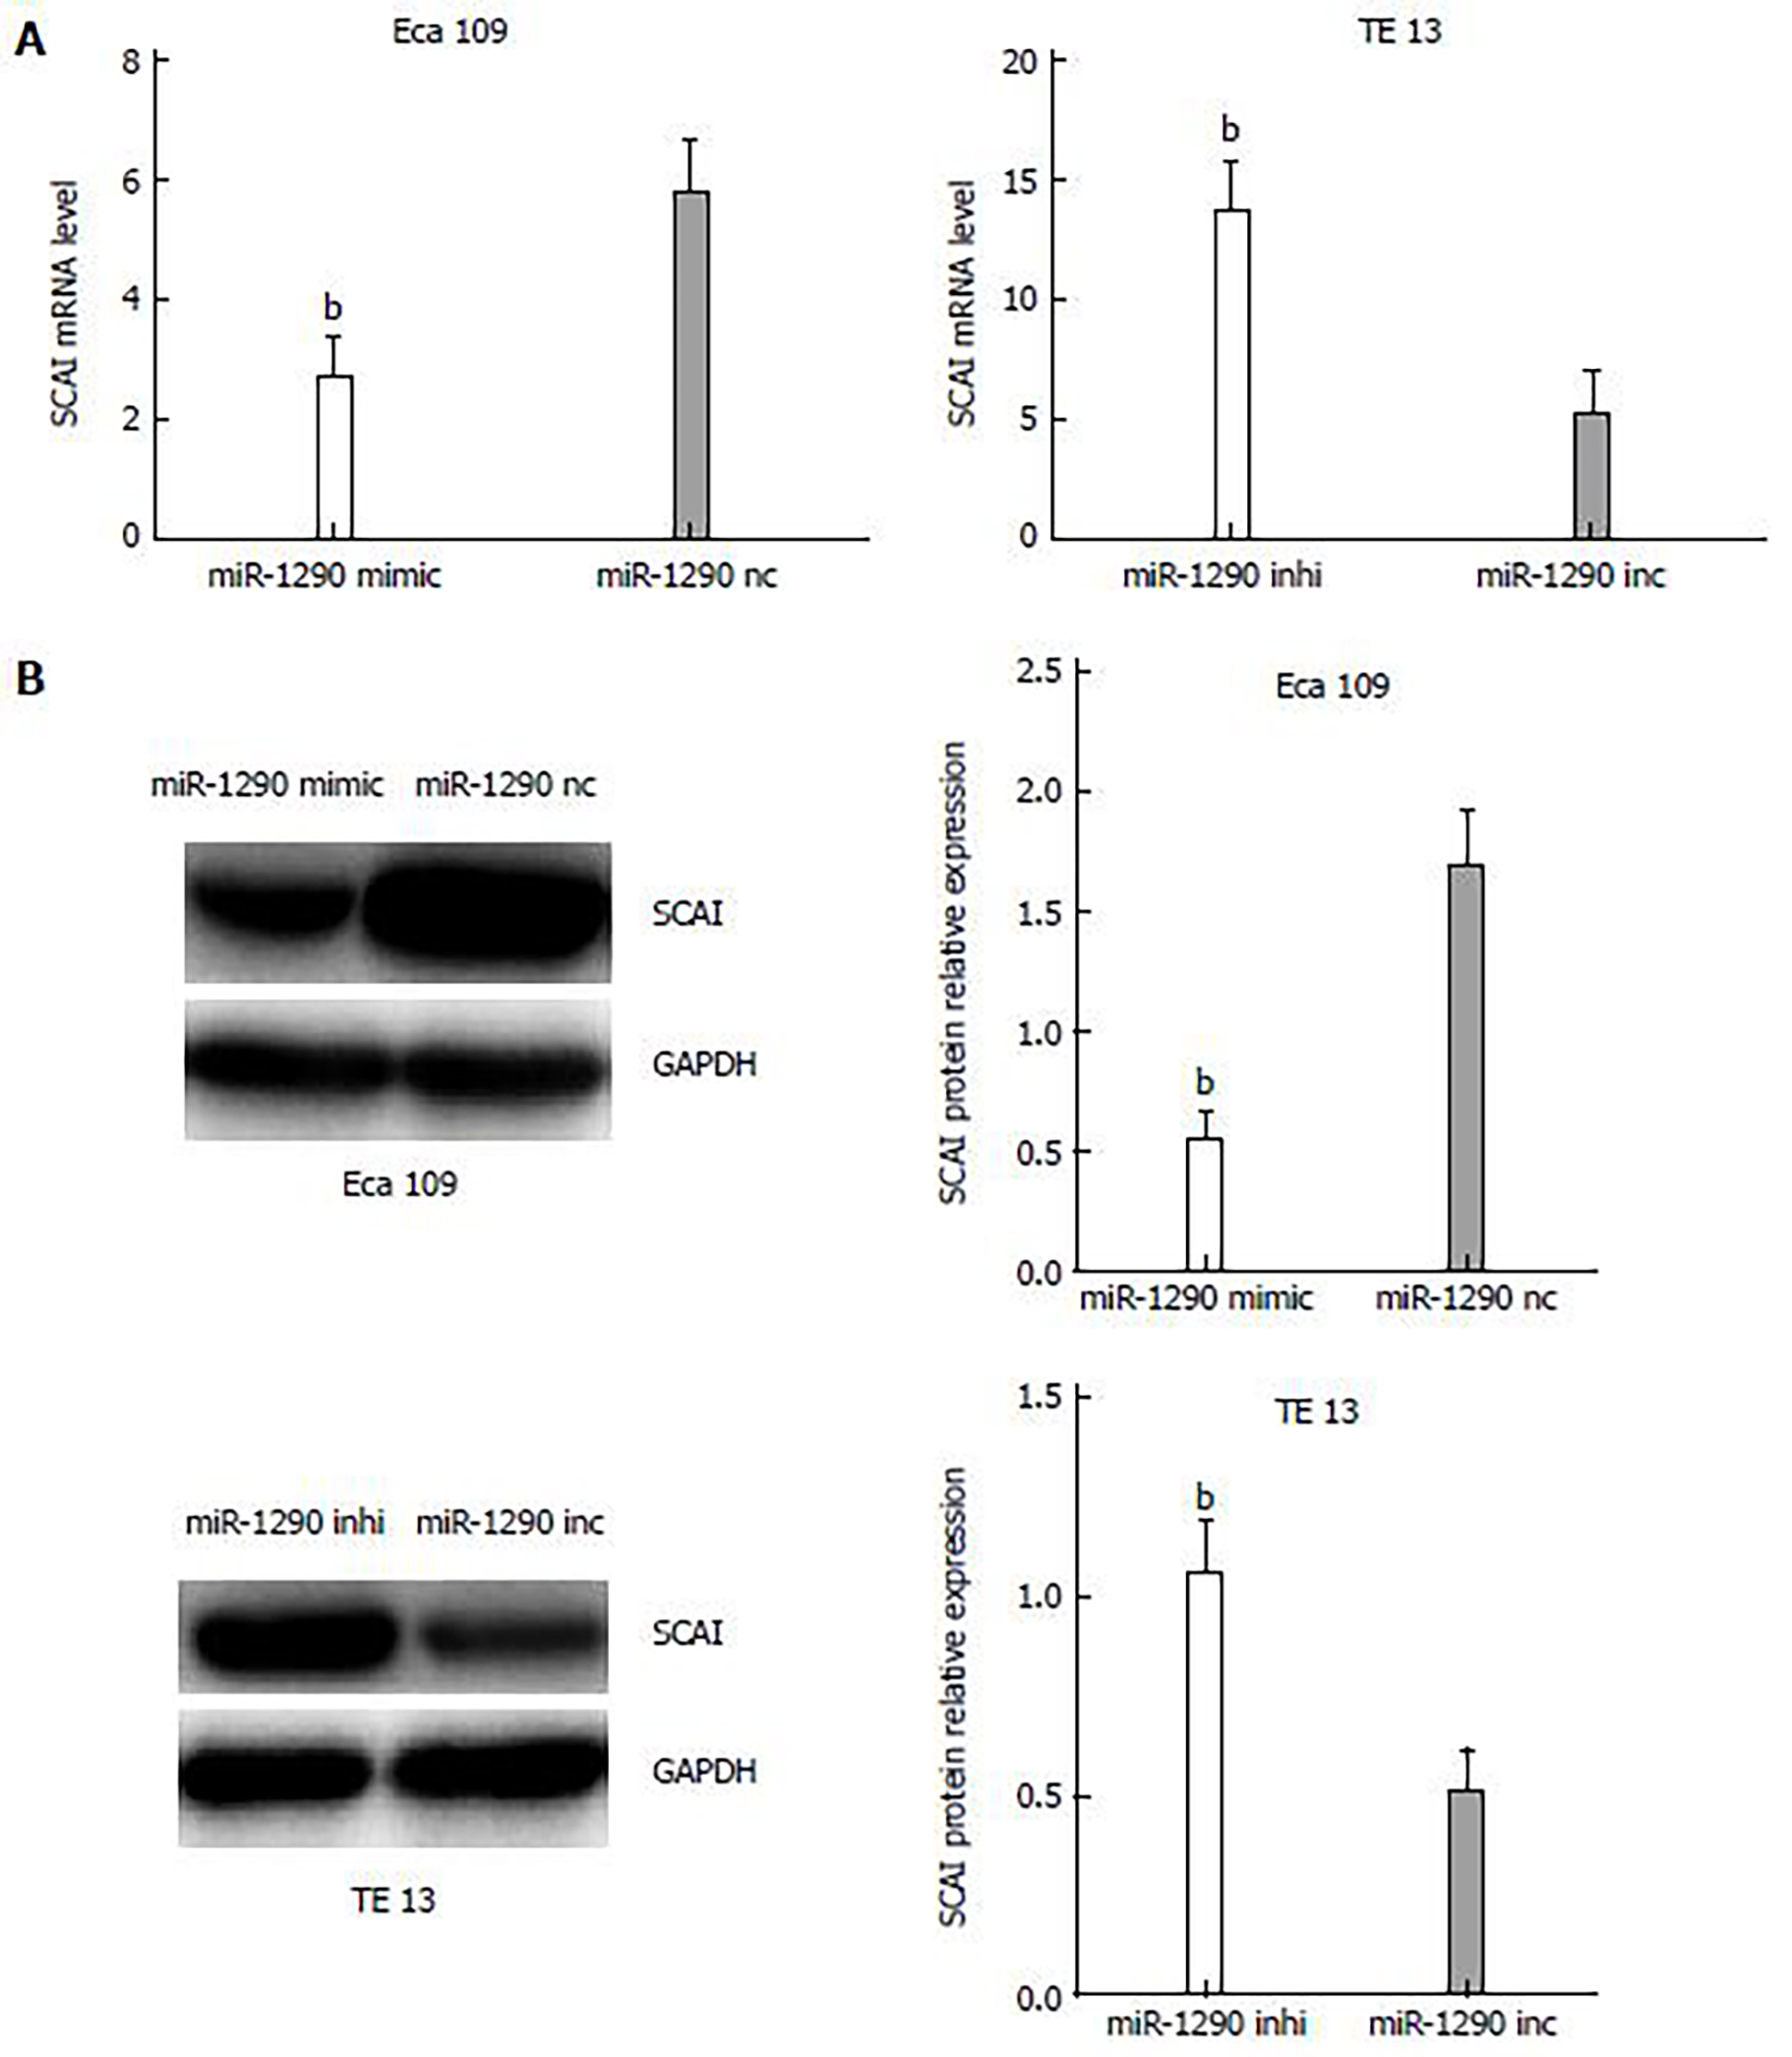
Figure 5 miR-1290 negatively regulates the mRNA and protein expression of suppressor of cancer cell invasion.
A: mRNA expression of SCAI in Eca109 cells transfected with miR-1290 mimic decreased evidently compared with that in cells transfected with miR-1290 nc. Conversely, the mRNA expression of SCAI in TE13 cells transfected with miR-1290 inhibitor increased evidently compared with that in cells transfected with miR-1290 inc; B: Protein expression of SCAI exhibited a similar pattern in Eca109 cells transfected with miR-1290 mimic and miR-1290 nc or in TE13 cells transfected with miR-1290 inhibitor and miR-1290 inc. bP < 0.01 vs control. nc: Negative control; inhi: Inhibitor; inc: Inhibitor negative control; SCAI: Suppressor of cancer cell invasion.
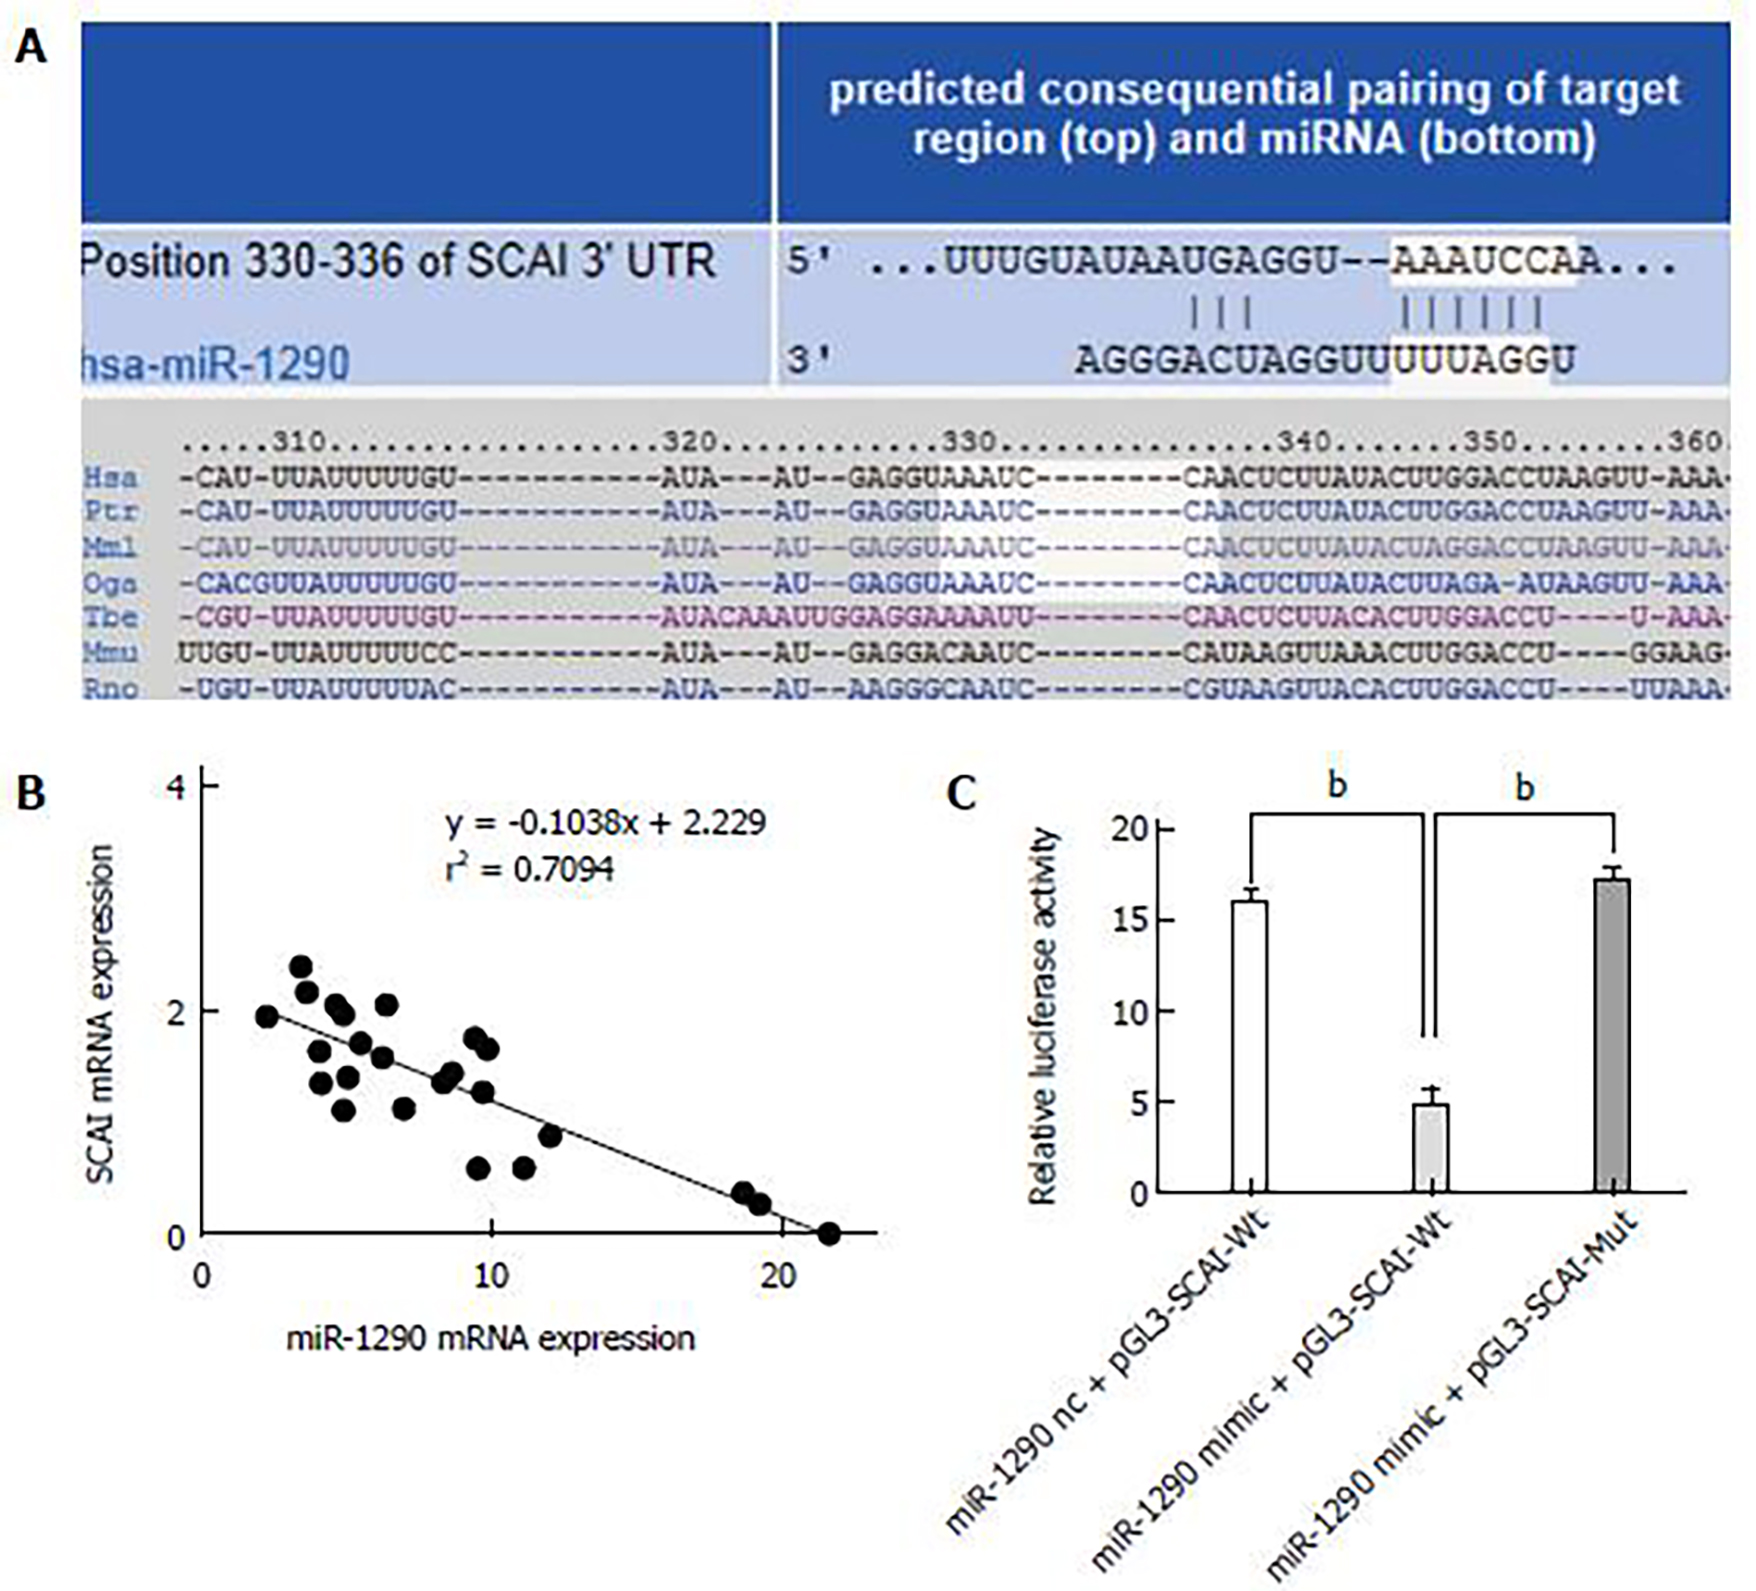
Figure 6 Suppressor of cancer cell invasion is a direct target of miR-1290.
A: Putative miR-1290 binding sequence in the 3′-UTR of the mRNA of SCAI is shown; B: Inverse correlation between miR-1290 and mRNA levels of SCAI in tissue samples was illustrated; C: Dual-luciferase reporter assay showed a significant decrease in the relative luciferase activity of wt-SCAI (wild-type SCAI 3′-UTR) co-transfected with miR-1290 mimic compared with that of mut-SCAI (mutant-type SCAI 3′-UTR; bP < 0.01 vs control) in Eca109 cells. SCAI: Suppressor of cancer cell invasion.
- Citation: Li M, He XY, Zhang ZM, Li S, Ren LH, Cao RS, Feng YD, Ji YL, Zhao Y, Shi RH. MicroRNA-1290 promotes esophageal squamous cell carcinoma cell proliferation and metastasis. World J Gastroenterol 2015; 21(11): 3245-3255
- URL: https://www.wjgnet.com/1007-9327/full/v21/i11/3245.htm
- DOI: https://dx.doi.org/10.3748/wjg.v21.i11.3245


