Copyright
©2014 Baishideng Publishing Group Inc.
World J Gastroenterol. Dec 28, 2014; 20(48): 18207-18215
Published online Dec 28, 2014. doi: 10.3748/wjg.v20.i48.18207
Published online Dec 28, 2014. doi: 10.3748/wjg.v20.i48.18207
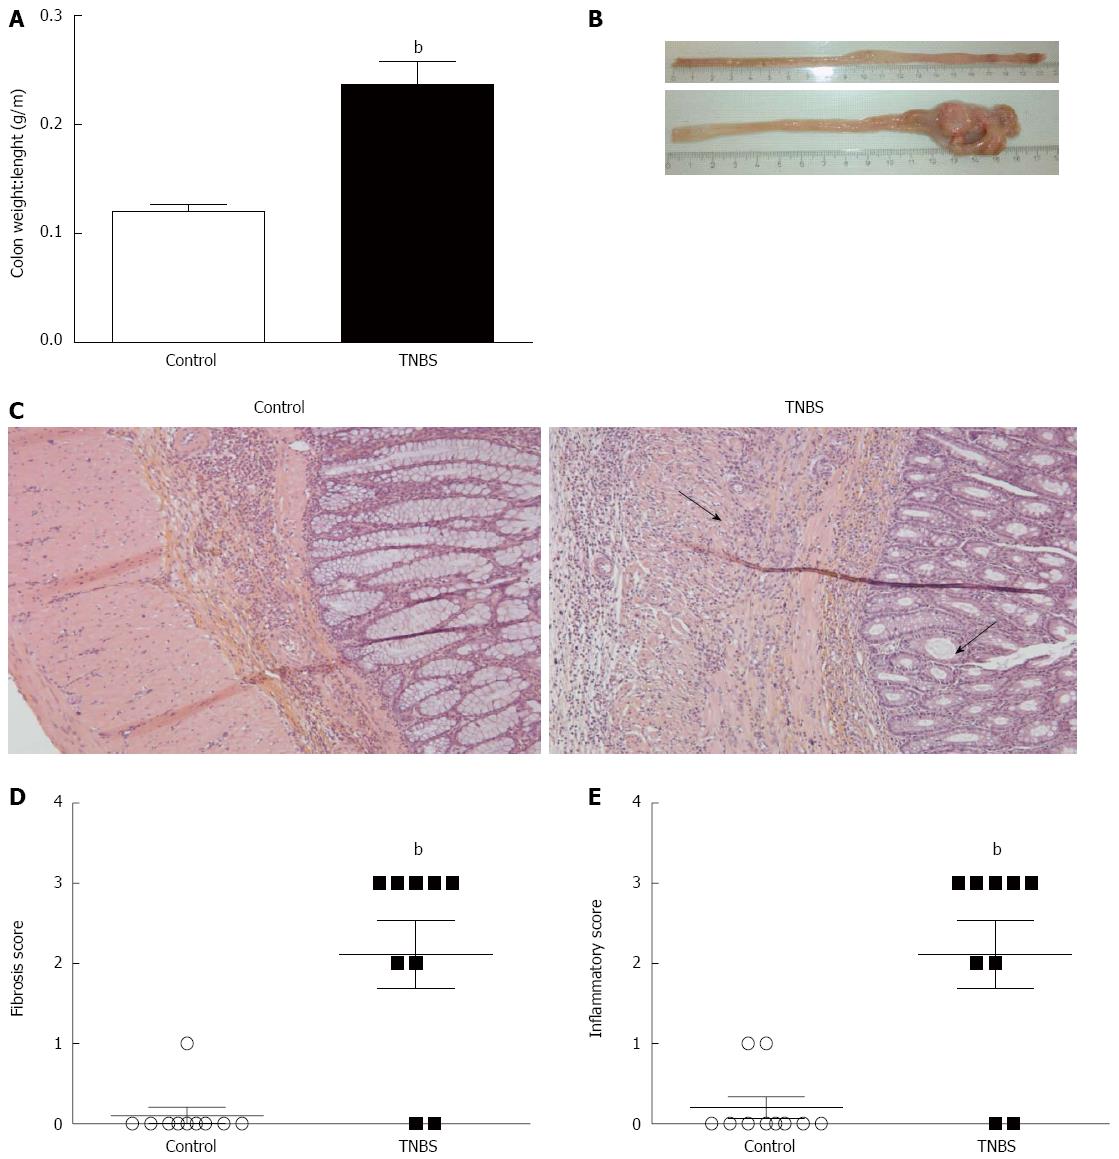
Figure 1 Validation of chronic 2,4,6-trinitrobenzene sulfonic acid-induced colitis.
Chronic colitis was induced by weekly intrarectal injections of 2,4,6-trinitrobenzene sulfonic acid (TNMS) for 6 wk. A: Colon weight/length (g/m) in control and TNBS groups; B: Colon macroscopy; C: Hematoxylin-eosin stained tissues in control and TNBS groups. In the TNBS sections, chronic inflammation (arrow) and fibrosis (arrow) led to architectural disorders, lymphotic infiltrate and fibrin deposits (magnification: 5× [left], 10× [right]); D: Histologic fibrosis score from 0 (no fibrosis) to 3 (severe fibrosis); E: Histologic inflammation score from 0 (no inflammation) to 3 (severe inflammation). Values are mean ± SE; bP < 0.01 vs control.
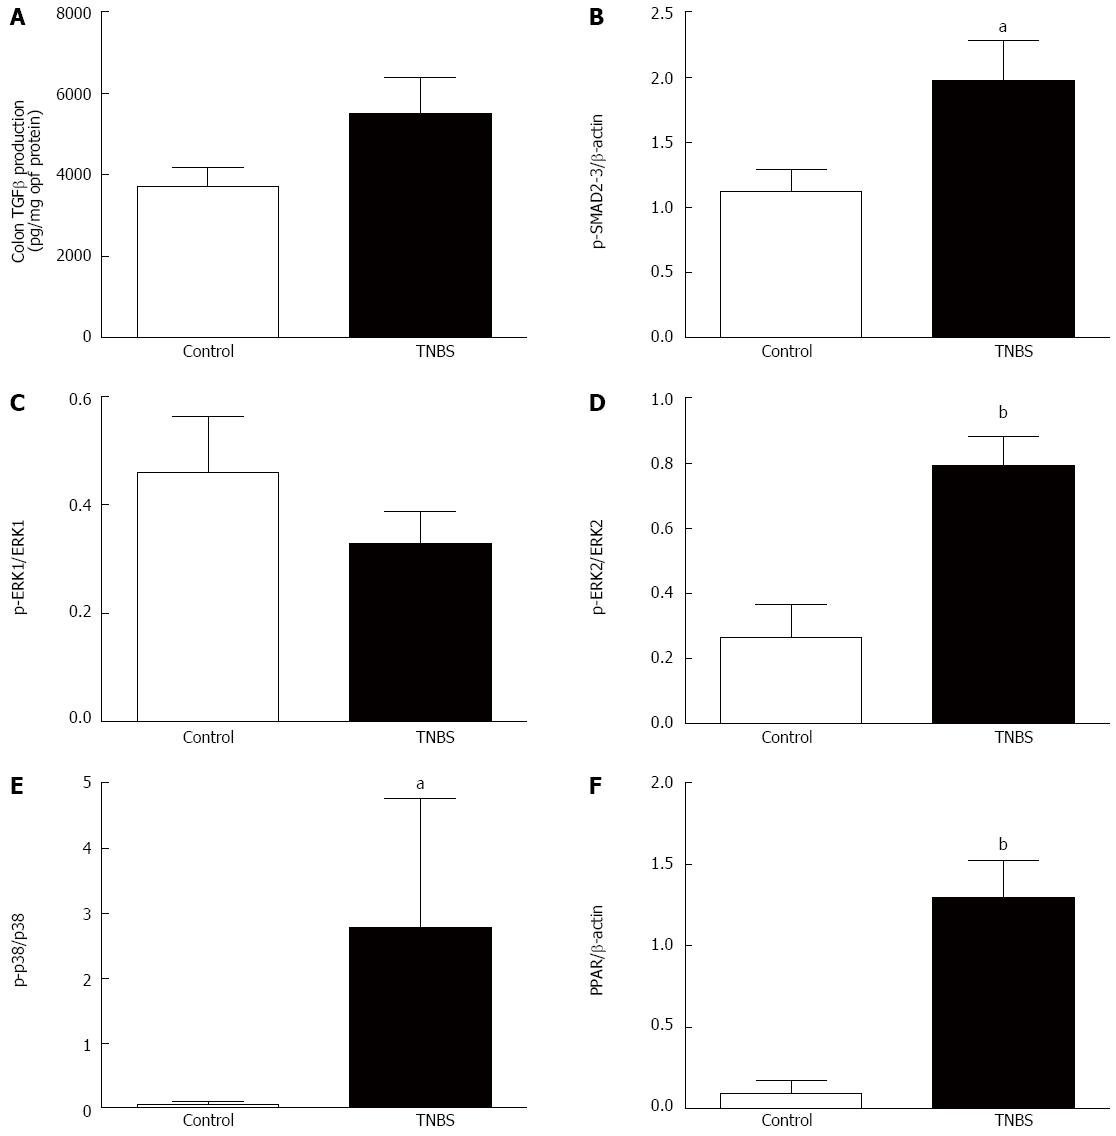
Figure 2 Colonic production of transforming growth factor-β and associated proteins in rats with chronic 2,4,6-trinitrobenzene sulfonic acid-induced colitis.
A: Transforming growth factor (TGF)-β; B: Phospho-Smad2/3; C: Phospho-extracellular regulated kinase (ERK)-1; D: Phospho-ERK2; E: Phospho-p38; F: Peroxisome proliferator activated receptor (PPAR)γ expression in control and 2,4,6-trinitrobenzene sulfonic acid (TNBS)-treated rats. Values are mean ± SE. aP < 0.05, bP < 0.01 vs control.
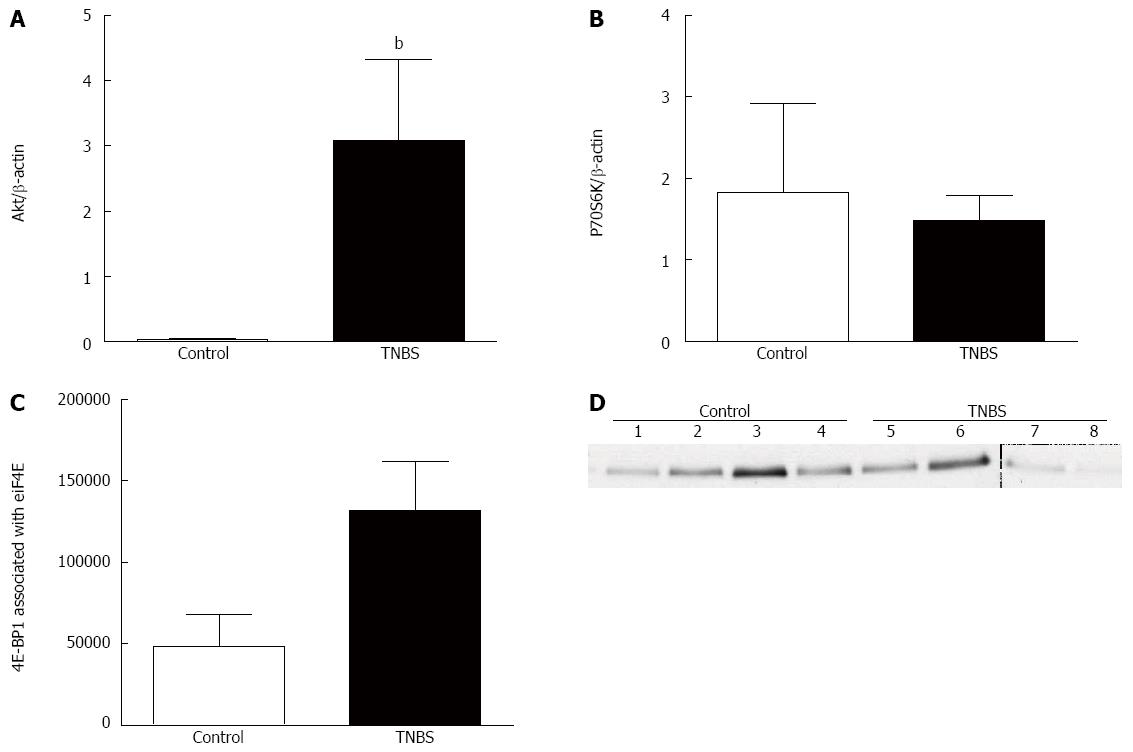
Figure 3 Chronic 2,4,6-trinitrobenzene sulfonic acid challenge induces Akt signaling.
A: Akt; B: p70 ribosomal protein S6 kinase (P70S6K) protein expression; C: eIF4E immunoprecipitation; D: Western blot analysis of eIF4E-4E-BP1 association. Values are means ± Standard error. bP < 0.01 vs control.
Figure 4 Chronic 2,4,6-trinitrobenzene sulfonic acid alters expression of tight junction proteins.
A: Occludin; B: Claudin-1 protein expression in the colons of 2,4,6-trinitrobenzene sulfonic acid (TNBS)- and control-treated rats. Values represent the mean expressed as a percentage of internal β-actin control, mean ± SE. bP < 0.01 vs control.
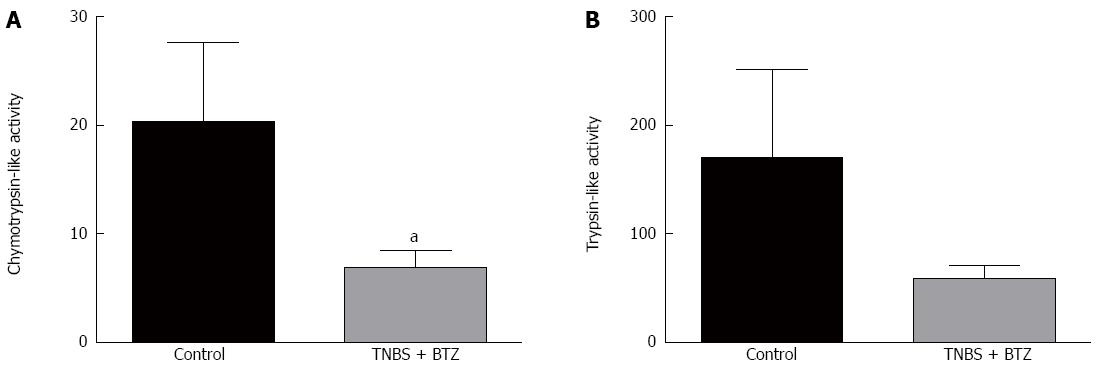
Figure 5 Proteasome inhibition by bortezomib treatment inhibits chymotrypsin-like activity.
A: Chymotrypsin-like activity; B: Trypsin-like activity. Values are mean ± SE. aP < 0.05 vs control. TNBS: 2,4,6-trinitrobenzene sulfonic acid; BTZ: Bortezomib.
- Citation: Loeuillard E, Bertrand J, Herranen A, Melchior C, Guérin C, Coëffier M, Aziz M, Déchelotte P, Savoye G, Marion-Letellier R. 2,4,6-trinitrobenzene sulfonic acid-induced chronic colitis with fibrosis and modulation of TGF-β1 signaling. World J Gastroenterol 2014; 20(48): 18207-18215
- URL: https://www.wjgnet.com/1007-9327/full/v20/i48/18207.htm
- DOI: https://dx.doi.org/10.3748/wjg.v20.i48.18207


