Copyright
©2014 Baishideng Publishing Group Inc.
World J Gastroenterol. Dec 28, 2014; 20(48): 18131-18150
Published online Dec 28, 2014. doi: 10.3748/wjg.v20.i48.18131
Published online Dec 28, 2014. doi: 10.3748/wjg.v20.i48.18131
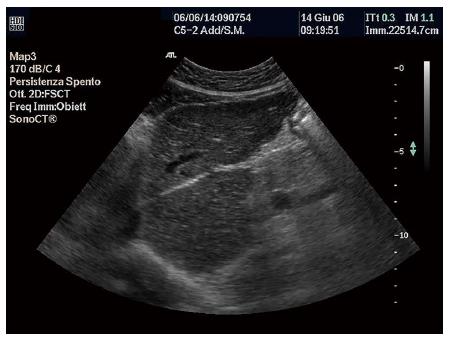
Figure 1 A longitudinal epigastric scan shows the left lobe of the liver with irregularity of liver surface, lobo caudate hypertrophy and coarse pattern.
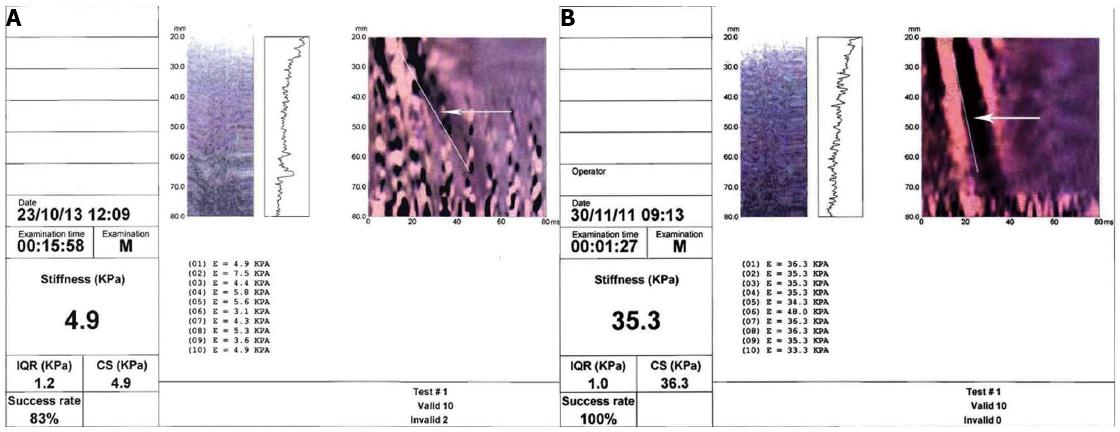
Figure 2 The stiffness (KPa); the interquartile-range = variability of valid measurements; the Success Rate = Ratio between the number of valid measurements/number of measurements in total (A and B).
The ratio between the speed of propagation of the wave and the elasticity of the liver parenchyma is represented by the slope of the white line (indicated by the white arrows in the elastogram). In panel A subject with normal value of liver stiffness. In panel B patient with value of liver stiffness compatible with liver cirrhosis.
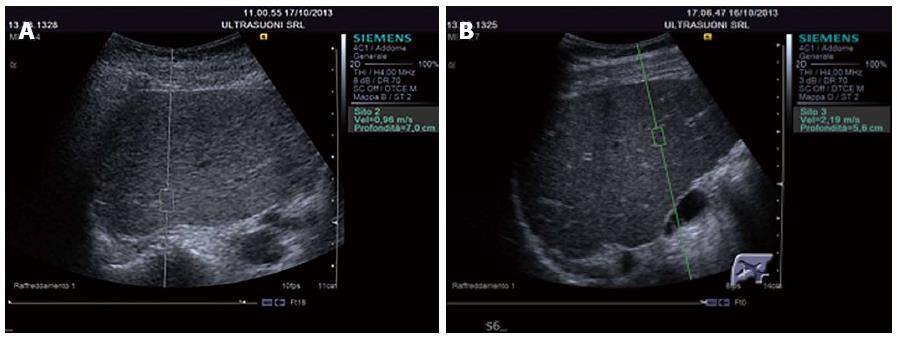
Figure 3 The region of interest of acoustic radiation force impulse speed is positioned in the right lobe of the liver, with an intercostal scan performed with the help of ultrasound B-mode (A and B).
On the right of the display there is the depth at which the measurement is performed and acoustic radiation force impulse (ARFI) speed measurement. In panel A subject with normal ARFI speed value (expressed in m/s). In panel B patient with ARFI speed value (expressed in m/s) compatible with liver cirrhosis.
- Citation: Soresi M, Giannitrapani L, Cervello M, Licata A, Montalto G. Non invasive tools for the diagnosis of liver cirrhosis. World J Gastroenterol 2014; 20(48): 18131-18150
- URL: https://www.wjgnet.com/1007-9327/full/v20/i48/18131.htm
- DOI: https://dx.doi.org/10.3748/wjg.v20.i48.18131


