Copyright
©2014 Baishideng Publishing Group Inc.
World J Gastroenterol. Dec 28, 2014; 20(48): 18131-18150
Published online Dec 28, 2014. doi: 10.3748/wjg.v20.i48.18131
Published online Dec 28, 2014. doi: 10.3748/wjg.v20.i48.18131
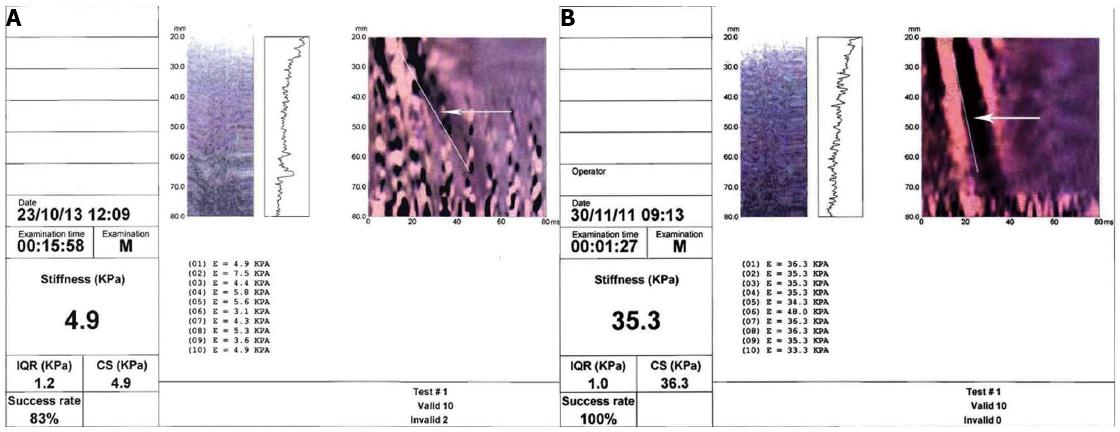
Figure 2 The stiffness (KPa); the interquartile-range = variability of valid measurements; the Success Rate = Ratio between the number of valid measurements/number of measurements in total (A and B).
The ratio between the speed of propagation of the wave and the elasticity of the liver parenchyma is represented by the slope of the white line (indicated by the white arrows in the elastogram). In panel A subject with normal value of liver stiffness. In panel B patient with value of liver stiffness compatible with liver cirrhosis.
- Citation: Soresi M, Giannitrapani L, Cervello M, Licata A, Montalto G. Non invasive tools for the diagnosis of liver cirrhosis. World J Gastroenterol 2014; 20(48): 18131-18150
- URL: https://www.wjgnet.com/1007-9327/full/v20/i48/18131.htm
- DOI: https://dx.doi.org/10.3748/wjg.v20.i48.18131


