Copyright
©2014 Baishideng Publishing Group Inc.
World J Gastroenterol. Jul 14, 2014; 20(26): 8681-8690
Published online Jul 14, 2014. doi: 10.3748/wjg.v20.i26.8681
Published online Jul 14, 2014. doi: 10.3748/wjg.v20.i26.8681
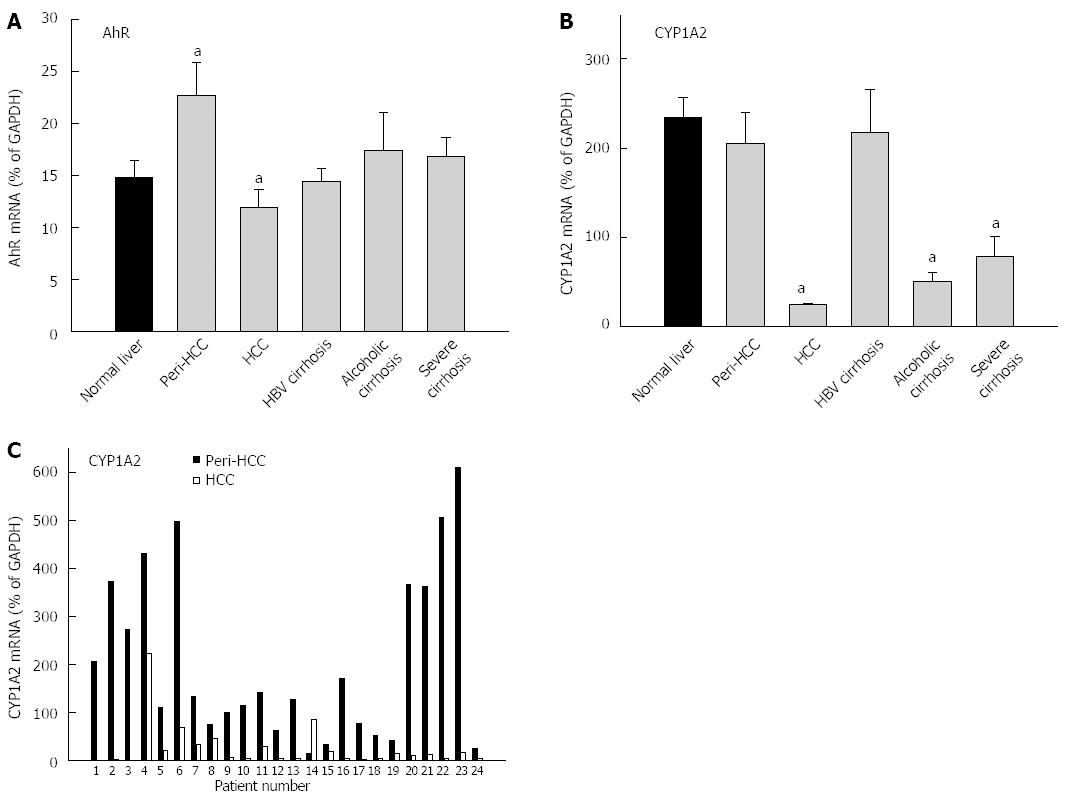
Figure 1 Expression of cytochrome P450 enzymes 1 family genes.
A: AhR; B: CYP1A2; C: CYP1A2 in 24 paired HCC and peri-HCC tissue from individual patients. The end-stage livers (HCC and corresponding peri-HCC tissue, n = 24, HBV cirrhosis, n = 27, alcoholic cirrhosis, n = 5 and severe cirrhosis, n = 13) and normal donor trimmed livers (n = 35) were collected at the Oriental Liver Transplant Center, Beijing, China. The data are mean ± SE, Significantly different from normal livers, aP < 0.05 vs normal liver; HCC different from peri-HCC tissues. AhR: Aryl hydrocarbon receptor; CYP: Cytochrome P450 enzymes; HCC: Hepatocellular carcinoma; HBV: Hepatitis B virus.
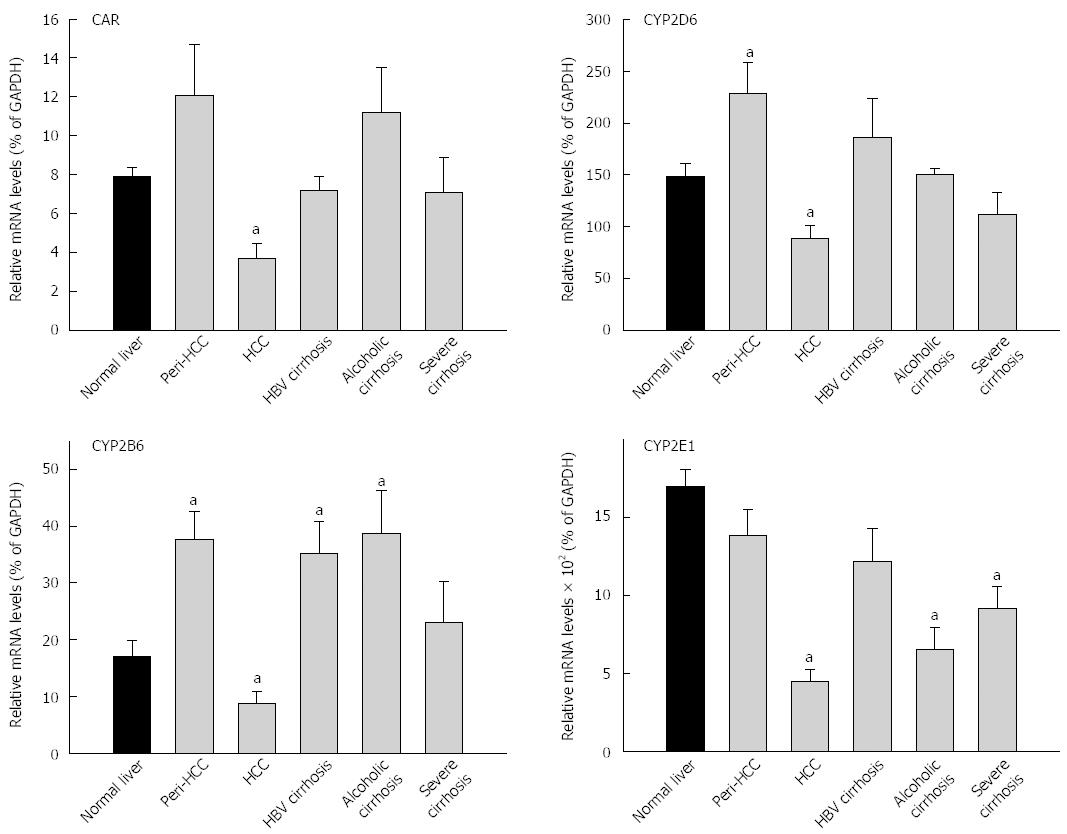
Figure 2 Expression of cytochrome P450 enzymes 2 family genes.
Right, CAR and CYP2B6; Left, CYP2D6 and CYP2E1. The 93 end-stage livers and normal donor trimmed livers (n = 35) were compared. The data are mean ± SE, Significantly different from normal livers, aP < 0.05 vs normal liver; HCC different from peri-HCC tissues. CAR: Constitutive androstane receptor; CYP: Cytochrome P450 enzymes; HCC: Hepatocellular carcinoma.
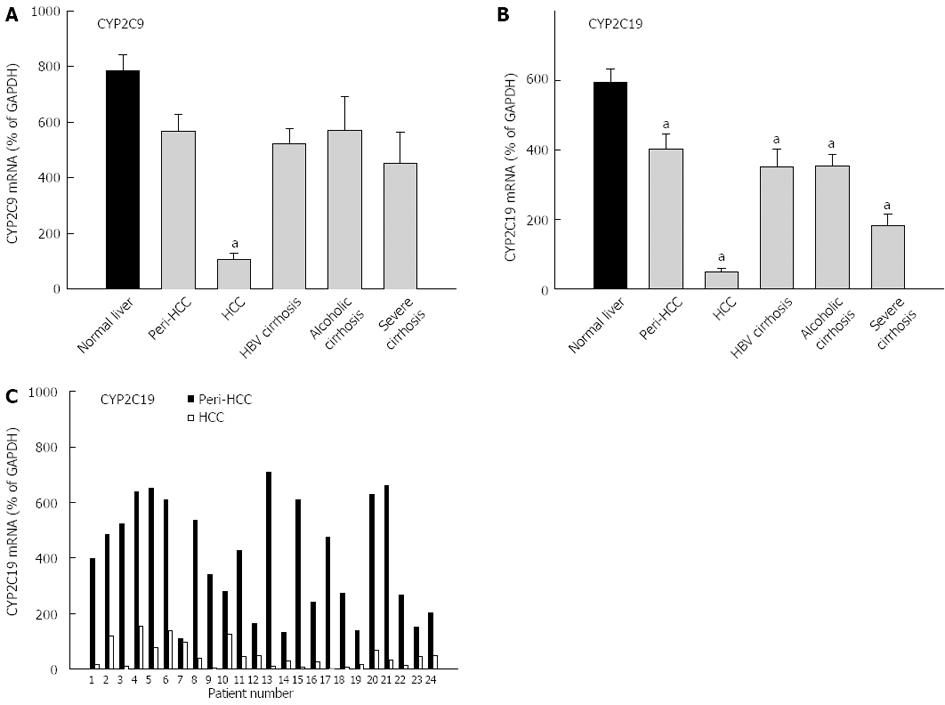
Figure 3 Expression of cytochrome P450 enzymes 2C family genes.
A: CYP2C9; B: CYP2C19; C: CYP1A2 in 24 paired HCC and peri-HCC tissue from individual patients. The 93 end-stage livers and 35 normal donor trimmed livers were compared. The data are mean ± SE, Significantly different from normal livers, aP < 0.05 vs normal liver; HCC different from peri-HCC tissues. CYP: Cytochrome P450 enzymes; HCC: Hepatocellular carcinoma.
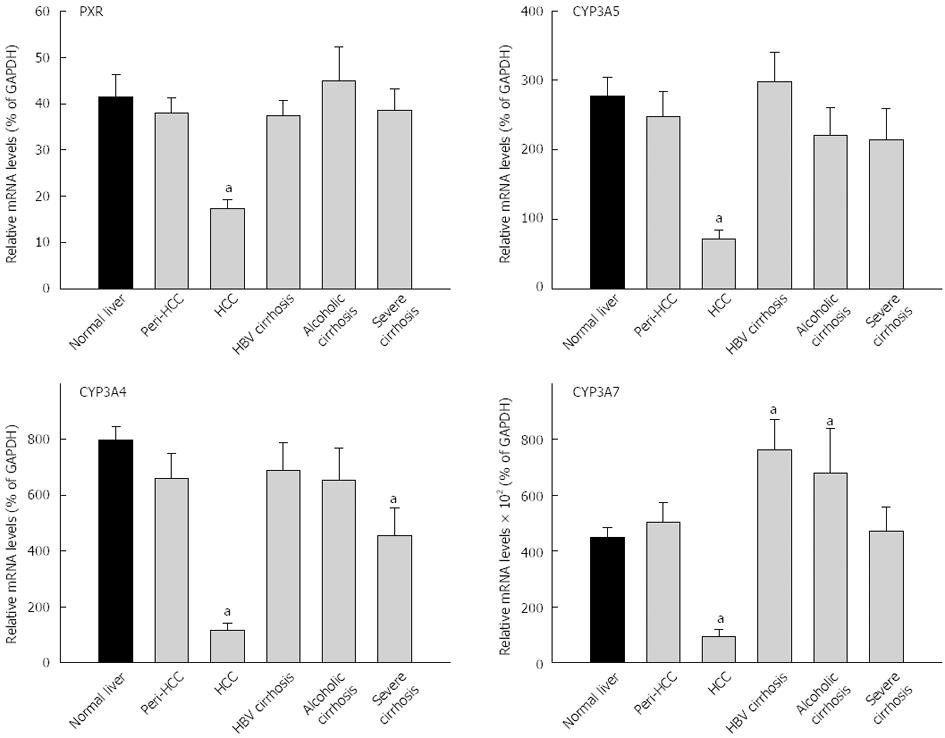
Figure 4 Expression of Cytochrome P450 enzymes 3 family genes.
Right, PXR and CYP3A4, left, CYP3A5 and CYP3A7. The data are mean ± SE, Significantly different from normal livers, aP < 0.05 vs normal liver; HCC different from peri-HCC tissues. PXR: Pregnane X receptor; CYP: Cytochrome P450 enzymes; HCC: Hepatocellular carcinoma.
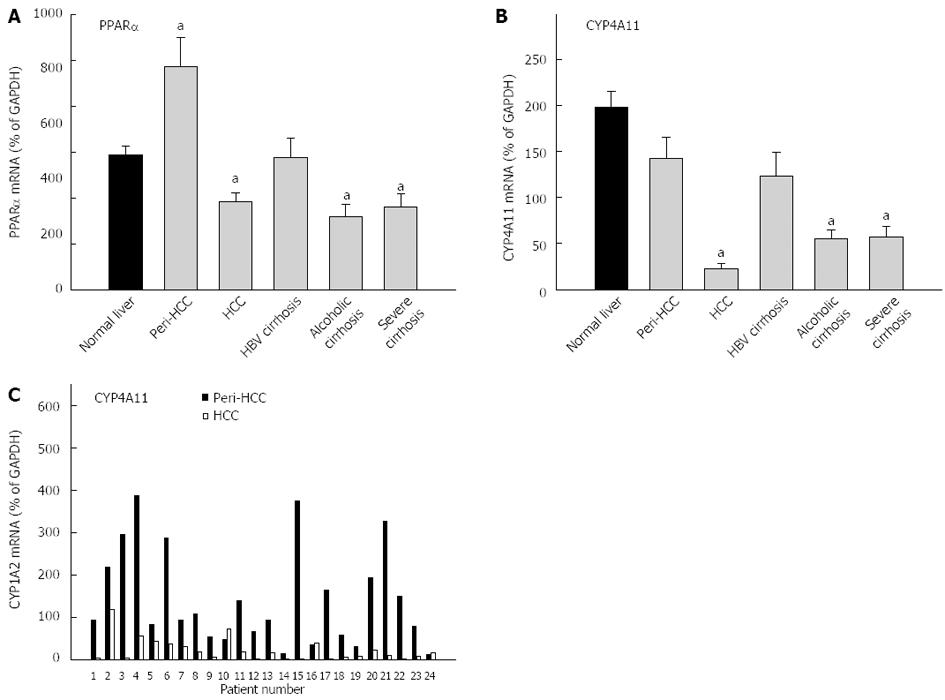
Figure 5 Expression of Cytochrome P450 enzymes 4 family genes.
A: PPARa; B: CYP4A11; C: CYP4A11 in 24 paired HCC and peri-HCC tissue from individual patients. Data are mean ± SE, Significantly different from normal livers, aP < 0.05 vs normal liver; HCC different from peri-HCC tissues. PPARα: Peroxisome proliferator-activated receptor; CYP: Cytochrome P450 enzymes; HCC: Hepatocellular carcinoma.
- Citation: Chen H, Shen ZY, Xu W, Fan TY, Li J, Lu YF, Cheng ML, Liu J. Expression of P450 and nuclear receptors in normal and end-stage Chinese livers. World J Gastroenterol 2014; 20(26): 8681-8690
- URL: https://www.wjgnet.com/1007-9327/full/v20/i26/8681.htm
- DOI: https://dx.doi.org/10.3748/wjg.v20.i26.8681


