Copyright
©2014 Baishideng Publishing Group Inc.
World J Gastroenterol. Jun 7, 2014; 20(21): 6680-6684
Published online Jun 7, 2014. doi: 10.3748/wjg.v20.i21.6680
Published online Jun 7, 2014. doi: 10.3748/wjg.v20.i21.6680
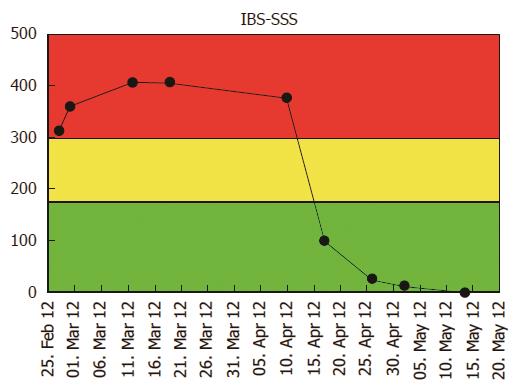
Figure 1 Patient self-managed web-based registry of irritable bowel syndrome symptom severity score during twelve weeks.
Y-axis: Irritable bowel syndrome symptom severity score (IBS-SSS) score which ranges from 0-500 points [Green: Remission and/or mild (0-175); yellow: Moderate disease severity (175-300); and red: Severe disease severity (> 300)]; X-axis: Control period (normal diet): week 1-6 and LFD period: week 7-12. FODMAP: Fermentable, oligosaccharides, disaccharides, monosaccharide’s and polyols; LFD: Low FODMAP diet.
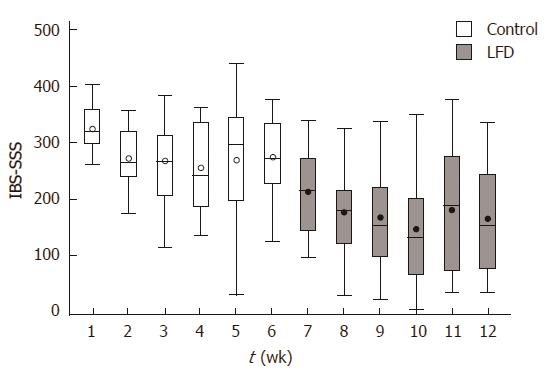
Figure 2 Box plot irritable bowel syndrome symptom severity score (median, range per week) during 12-wk in 19 irritable bowel syndrome patients.
Y axis: IBS-SSS scores from 0-500 points; X axis: Week 1-12. Control period (normal diet): Week 1-6; LFD period: Week 7-12. FODMAP: Fermentable, oligosaccharides, disaccharides, monosaccharide’s and polyols; LFD: Low FODMAP diet.
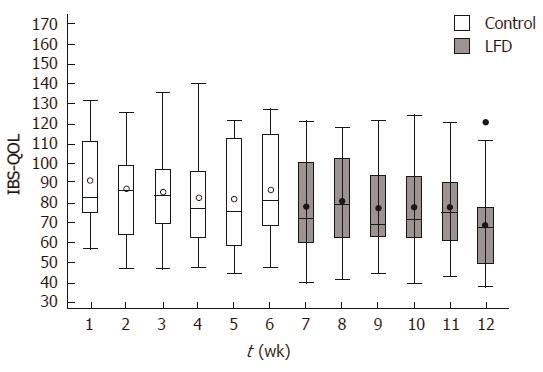
Figure 3 Box plot of irritable bowel syndrome quality of life (median, range per week) during 12-wk in 19 irritable bowel syndrome patients.
Y axis: Irritable bowel syndrome quality of life (IBS-QOL) scores from 170 (worst) to 34 (best) points; X axis: Week 1-12. Control (normal diet) period: Week 1-6; LFD period: Week 7-12. FODMAP: Fermentable, oligosaccharides, disaccharides, monosaccharide’s and polyols; LFD: Low FODMAP diet.
- Citation: Pedersen N, Vegh Z, Burisch J, Jensen L, Ankersen DV, Felding M, Andersen NN, Munkholm P. Ehealth monitoring in irritable bowel syndrome patients treated with low fermentable oligo-, di-, mono-saccharides and polyols diet. World J Gastroenterol 2014; 20(21): 6680-6684
- URL: https://www.wjgnet.com/1007-9327/full/v20/i21/6680.htm
- DOI: https://dx.doi.org/10.3748/wjg.v20.i21.6680


