Copyright
©2014 Baishideng Publishing Group Inc.
World J Gastroenterol. Jun 7, 2014; 20(21): 6412-6419
Published online Jun 7, 2014. doi: 10.3748/wjg.v20.i21.6412
Published online Jun 7, 2014. doi: 10.3748/wjg.v20.i21.6412
Figure 1 Neutrophilic proliferative zone foveolitis.
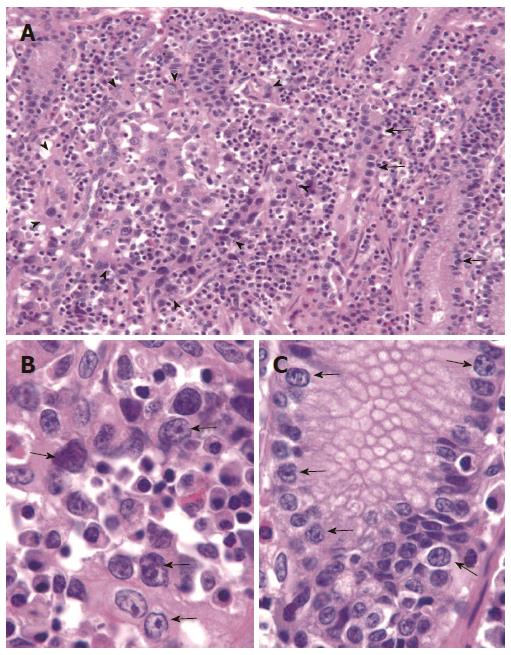
A: Intense infiltration specifically focused on the proliferative zone of gastric pits (arrows). (HE, × 40); B: Neutrophils targeting the proliferative zone foveolar epithelium (arrows), while the surface is free of significant infiltration (long arrow) (HE, × 30); C: Infiltrate consisting of pure neutrophils in single cells or small aggregates (arrows). Neutrophils in lamina propria close to the foveolitis (arrowheads), suggesting an active movement into the epithelium (HE, × 150).
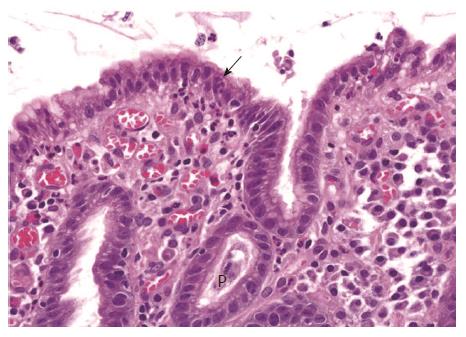
Figure 2 Surface neutrophilic foveolitis.
A biopsy from a male subject with recurrent episodes of erosive gastritis, showing a small focus of neutrophilic infiltration in the surface epithelium (arrow). P: Proliferative zone (HE, × 50).
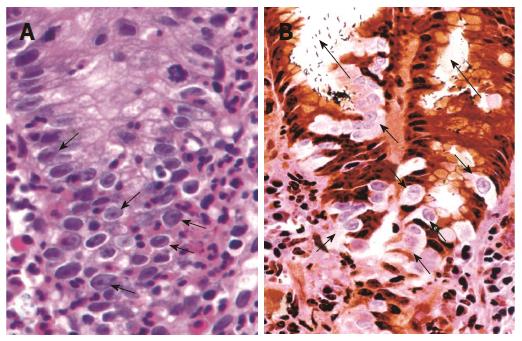
Figure 3 Malgun cell change.
A: Malgun cell change of the epithelial cells at the site of neutrophilic infiltration (arrows), showing large, pale nucleus, prominent nucleolus, and smooth nuclear envelope. They often show characteristic ‘‘perinuclear halo’’ reflecting artificial retraction of cytoplasm (HE, × 150). B: Malgun cells are not stained by silver impregnation in triple silver staining (arrows), demarcating them clearly from other cells. They develop as single cells at the proliferative zone in association with neutrophilic foveolitis, and make small clusters as they move upward to the surface suggesting a clonogenic potential. Note numerous Helicobacter pylori attached to the epithelium and in the lumen (long arrows). (Triple silver staining, × 150).
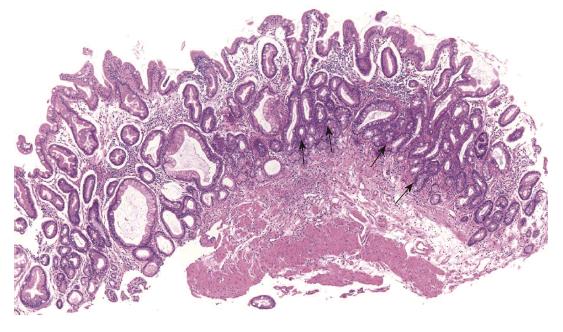
Figure 4 Chronic metaplastic gastritis with atypical Malgun cell change.
Panoramic view showing irregular arrangement of pits with multifocal crowding of small atypical glands (arrows) (HE, × 10).
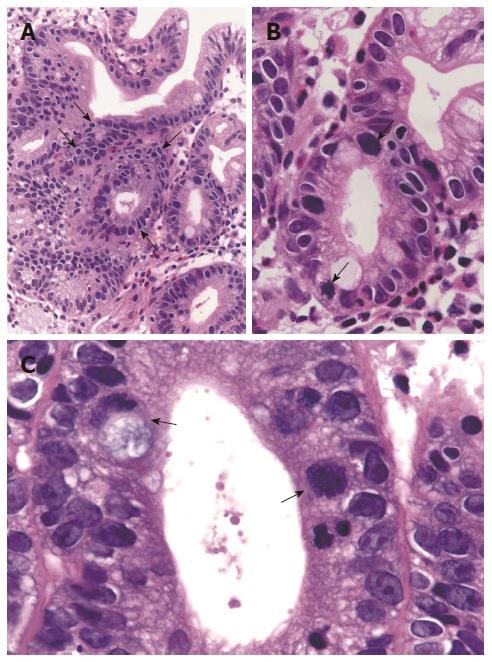
Figure 5 Atypical Malgun cells.
A: Atypical malgun cells (AMC) develops at the proliferative zone, showing characteristic ‘‘perinuclear halo’’ but hyperchromatic nuclei (arrows) (HE, × 45). B: Magnified view of A, showing 2 mulberry cells (arrows) in AMC (HE, × 100). C: High power view of AMC and Mulberry cells. Atypical Malgun cells show irregular nuclear folding, hyperchromatism, coarse chromatin, and multiple nucleoli nuclear folding. Two Mulberry cells with extreme nuclear folding are indicated by arrows. The left one shows cytoplasmic mucin (HE, × 400).
Figure 6 Atypical Malgun cells at the proliferative zone of pit (arrowheads).
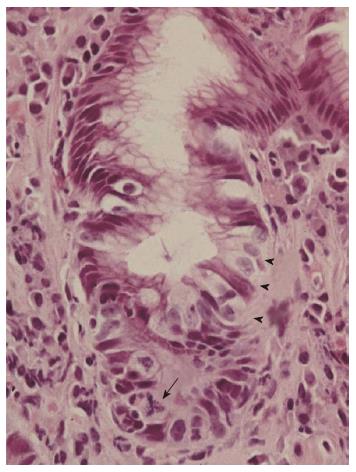
Note an atypical mitotic figure (arrow) (HE, × 150).
Figure 7 Atypical Malgun cells with progressive atypia.
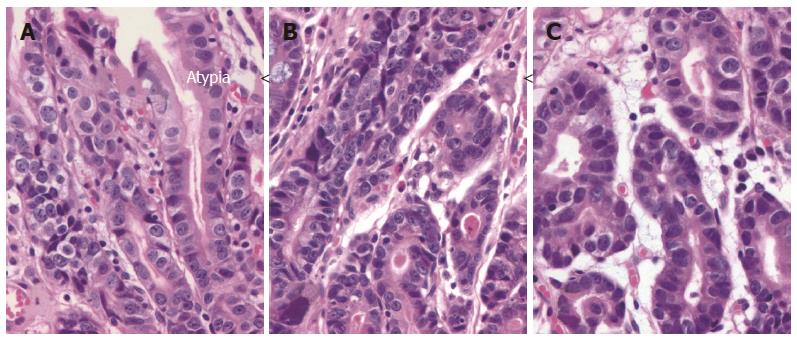
A-C: Three nearby loci of Atypical malgun cells (AMC) at antrum of a male patient showing progressive glandular and cytological atypia from A to C (HE, × 75).
Figure 8 Gastric cancer developing in atypical Malgun cells.
A: Small focus of early mucosal gastric cancer (arrowheads) developing next to Atypical malgun cells (AMC) (arrows) at the proliferative zone (HE, × 30); B, C: High power views of carcinoma (B) and AMC (C) in A, respectively. Although cancer cells (B) are larger than AMC (C) at the same magnification, they keep cytological characteristics similar to AMC. No other ‘‘premalignant lesion’’ is present, supporting direct malignant transformation from AMC (HE, × 120).
Figure 9 Major routes for gastric carcinogenesis from Helicobacter pylori gastritis.
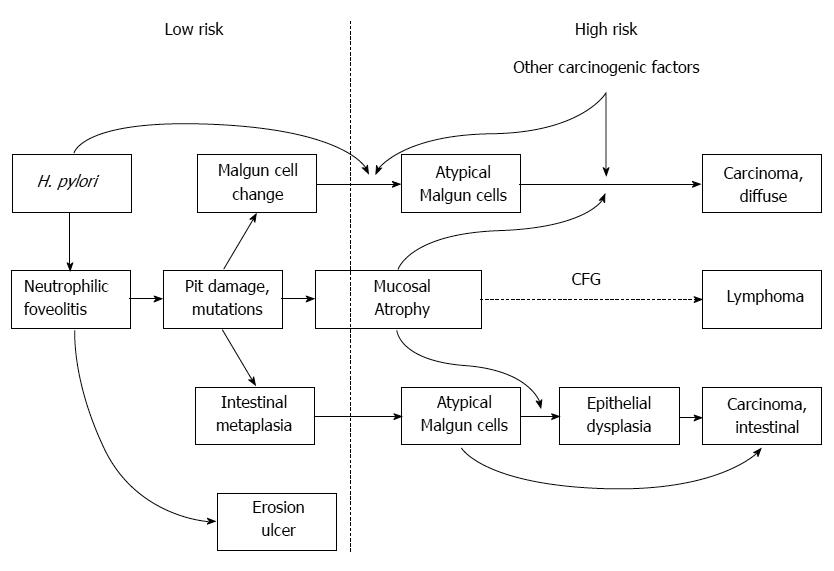
Low and high risk gastritis are delineated. CFG: Chronic follicular gastritis; H. pylori: Helicobacter pylori.
-
Citation: Lee I. Critical pathogenic steps to high risk
Helicobacter pylori gastritis and gastric carcinogenesis. World J Gastroenterol 2014; 20(21): 6412-6419 - URL: https://www.wjgnet.com/1007-9327/full/v20/i21/6412.htm
- DOI: https://dx.doi.org/10.3748/wjg.v20.i21.6412


