Copyright
©2013 Baishideng Publishing Group Co.
World J Gastroenterol. Dec 14, 2013; 19(46): 8502-8514
Published online Dec 14, 2013. doi: 10.3748/wjg.v19.i46.8502
Published online Dec 14, 2013. doi: 10.3748/wjg.v19.i46.8502
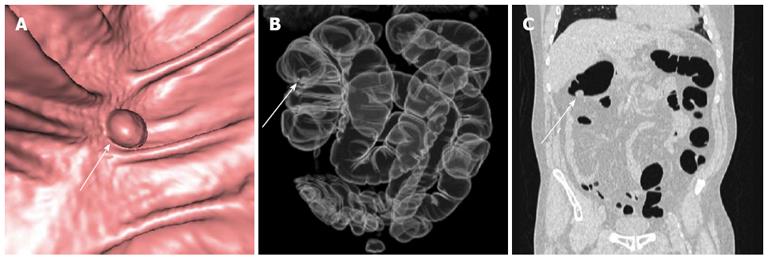
Figure 1 A 64-year-old male patient who underwent routine screening colonoscopy terminated due to severe discomfort.
A: Virtual computed tomography (CT) colonoscopy detected a 1 cm polyp (arrow) in right colonic flexure, biopsy proved as adenocarcinoma; Fly-through with a 3D view of the polyp; B: The virtual X-ray reconstruction; C: Coronal reconstruction using the lung window shows the tumor clearly.
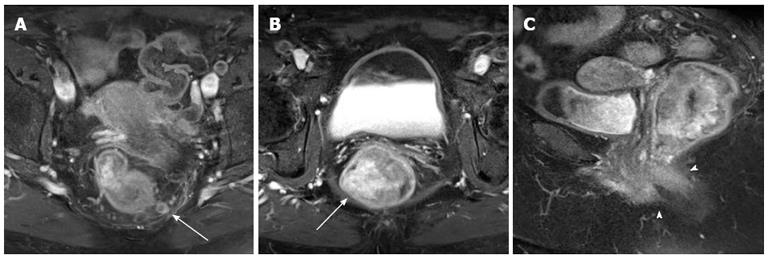
Figure 2 Abdominal magnetic resonance imaging for local staging of rectal adenocarcinoma in a 58-year-old female.
A, B: Post-contrast fat-suppressed axial images show 7 cm long contrast enhancing neoplastic mass with lymph node metastases within the mesorectal fascia (arrow); C: Peripheral desmoplastic reaction (arrowheads) on T1 sagittal images.
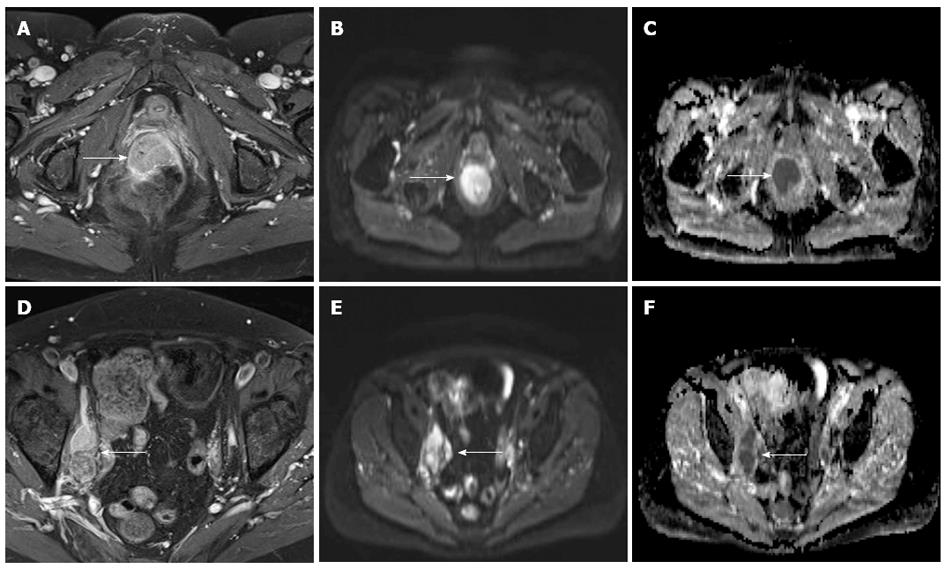
Figure 3 A 58-year-old female with biopsy-proven adenocarcinoma of the rectum.
A: Post-contrast fat-suppressed axial T1 images show a contrast-enhancing mass (arrow), extending from rectum into the anal canal and invading the posterior aspect of the vagina; B, E: Both, the primary tumor and the lymph node metastases, show an hyperintense signal on diffusion weighted imaging; C, F: An reduced apparent diffusion coefficient reflecting the tight tumor cellularity; D: Enlarged, contrast-enhancing lymph nodes along the right iliac axis (arrow).
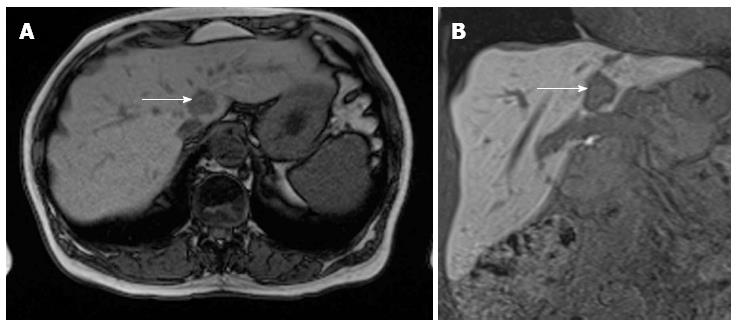
Figure 4 A 63-year-old female with colorectal cancer and suspected liver metastasis.
A: Primovist images acquired 10 min p.i., during the hepatobiliary phase using a T1 VIBE isovoxel sequence with coronal orientation; B: Due to the high resolution axial reconstructions are also done routinely. The lesion in segment I (arrow) is clearly demarcated as a contrast defect because of the missing hepatocytes in the metastasis while the other parts of the liver show a bright contrast enhancement.
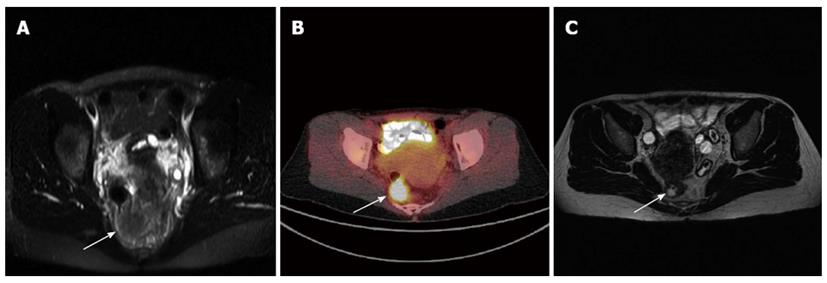
Figure 5 Initial rectal cancer staging of a 48 year old female.
A: Occlusion of the rectum by solid tumor on magnetic resonance imaging (MRI) (arrow); B: Corresponding high Fluorodeoxyglucose metabolism in the Fluorodeoxyglucose positron emission tomography/computed tomography; C: Post treatment (chemoradiation therapy) magnetic resonance imaging shows a clear tumor size reduction (arrow) with a continuing lumen after chemoradiation therapy.
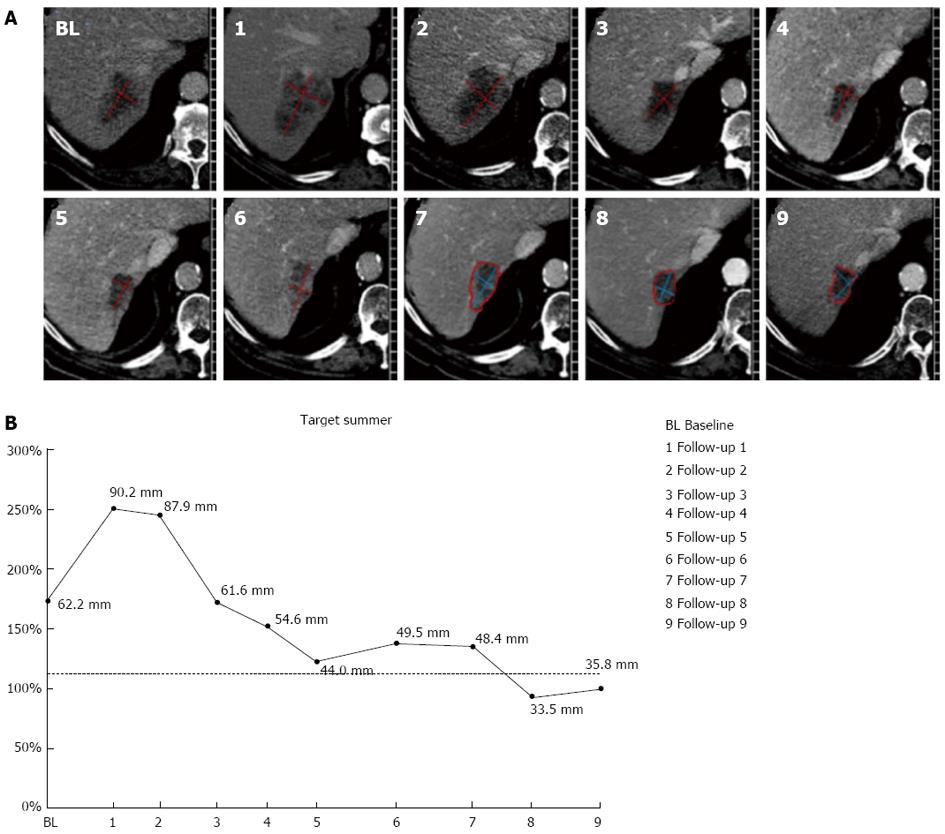
Figure 6 An automated software (mint Lesion®, Mint Medical GmbH, Heidelberg, Gemany) used at our Institution for tumor treatment response evaluation.
A: Computed tomography images show liver metastasis in a patient with colorectal cancer on nine follow-up examinations; B: Graphical evaluation depicts the measurement of the lesion standardized throughout the whole staging period consisting of baseline (BL) and nine follow up assessments (1-9). Tumor response is evaluated according to Response Evaluation Criteria in Solid Tumors.
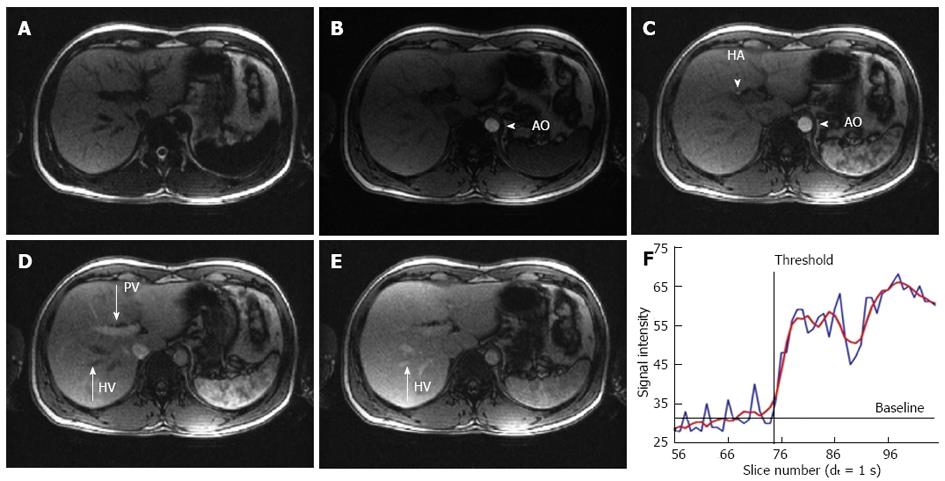
Figure 7 Magnetic resonance imaging images of the T1-weighted sequence for hepatic transit time analysis at different time points.
A: Baseline image without contrast; B: Arterial phase with opacification of the aorta (AO); C: Arterial phase with opacification of the AO and the hepatic artery (HA); D: Portal venous phase with additional enhancement of the portal vein (PV); Note that the hepatic veins (HV) are still not enhanced; E: Venous phase with complete opacification of all vessels including the HV; F: Example of a typical time intensity curve acquired from a ROI placed at the position of the HA; The raw data in the graph (blue line) has a modulation due to patient breathing. Therefore the curve has to be fitted and smoothed (red line). The calculated baseline as well as threshold point, demonstrating the arrival time of the contrast agent is drawn.
- Citation: Kekelidze M, D’Errico L, Pansini M, Tyndall A, Hohmann J. Colorectal cancer: Current imaging methods and future perspectives for the diagnosis, staging and therapeutic response evaluation. World J Gastroenterol 2013; 19(46): 8502-8514
- URL: https://www.wjgnet.com/1007-9327/full/v19/i46/8502.htm
- DOI: https://dx.doi.org/10.3748/wjg.v19.i46.8502


