Copyright
©2012 Baishideng Publishing Group Co.
World J Gastroenterol. Aug 28, 2012; 18(32): 4288-4299
Published online Aug 28, 2012. doi: 10.3748/wjg.v18.i32.4288
Published online Aug 28, 2012. doi: 10.3748/wjg.v18.i32.4288
Figure 1 Schematic overview of the trinitrobenzene sulfonate induced colitis model.
Mice were injected intravenously with either phosphate-buffered saline (PBS) or adeno associated virus (AAV) 5 [cytomegalovirus (CMV) promoter T-cell epitopes (Tregitope) 167]. Ten days after AAV-mediated Tregitope delivery acute colitis was initiated by intra-rectal administration of 1.5 mg trinitrobenzene sulfonate (TNBS) in 40% ethanol followed by a second TNBS treatment (0.75 mg in 20% ethanol) 8 d later. Control groups consisted of mice not treated by TNBS (healthy control group) and mice treated by TNBS only (diseased control group).
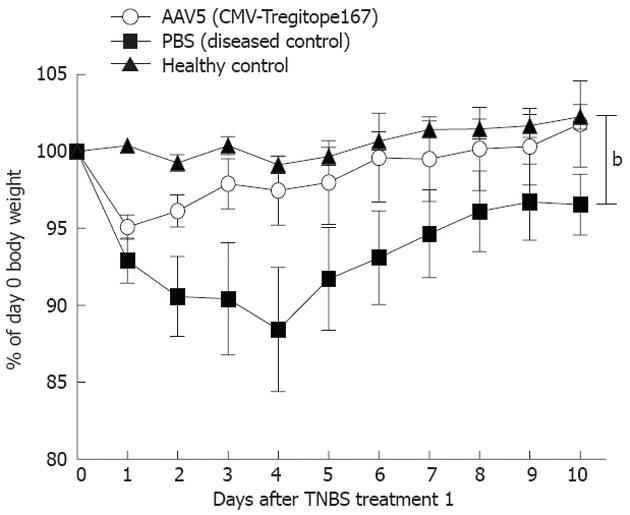
Figure 2 Adeno associated virus serotype 5 mediated delivery of regulatory T-cell epitope 167 ameliorates trinitrobenzene sulfonate induced colitis development over time.
Mice were injected intravenously with either phosphate-buffered saline (PBS) or adeno associated virus (AAV) 5 [cytomegalovirus (CMV) promoter T-cell epitopes (Tregitope) 167]. 10 d after AAV-mediated Tregitope delivery, acute colitis was initiated by intra-rectal administration of 1.5 mg trinitrobenzene sulfonate (TNBS) in 40% ethanol followed by a second TNBS treatment (0.75 mg in 20% ethanol) 8 d later. Control groups consisted of mice not treated by TNBS (healthy control group) and mice treated by TNBS only (diseased control group). Disease progression was assessed by changes in daily body weight. Animals were withdrawn from the study when their weight loss was > 25% of their original body weight. Overall for the healthy controls, n = 9; adeno associated virus (AAV) 5 (CMV-Tregitope 167) treated, n = 7; diseased controls, n = 6, were included in the analysis. The data were analyzed using a 1 way analysis of variance, followed by Dunn’s post hoc test for multiple comparisons. Data are presented as mean ± SE of all the mice. bP value < 0.01 between PBS (diseased control group) and both AAV5 (CMV-Tregitope 167) treated and the healthy control group.
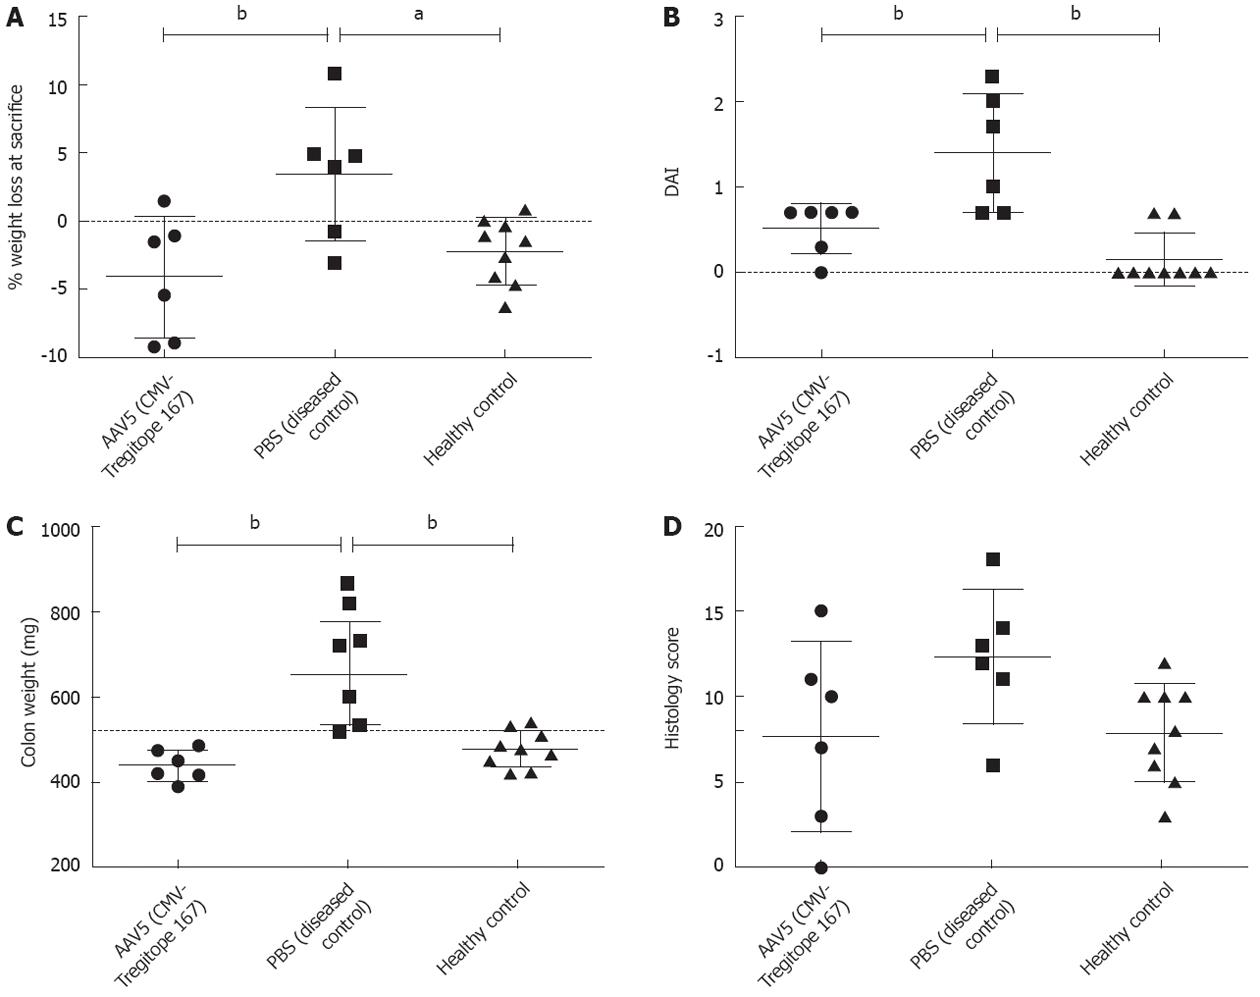
Figure 3 Adeno associated virus serotype 5 mediated delivery of regulatory T-cell epitope 167 alleviates colonic inflammation as determined at the day of sacrifice.
Mice were injected intravenously with either phosphate-buffered saline (PBS) or adeno associated virus (AAV) 5 [cytomegalovirus (CMV) promoter T-cell epitopes (Tregitope) 167]. Ten days after AAV-mediated Tregitope delivery acute colitis was initiated by intra-rectal administration of 1.5 mg trinitrobenzene sulfonate (TNBS) in 40% ethanol followed by a second treatment with TNBS (0.75 mg in 20% ethanol) 8 d later. Control groups consisted of mice not treated by TNBS (healthy control group) and mice treated by TNBS only (diseased control group). Disease progression was assessed by changes in daily body weight as well as macroscopic and microscopic scores on the day of sacrifice. A: Animal body weight change on day 20 upon sacrifice. The values of body weight are expressed as a percentage of body weight on the day of the first TNBS treatment; B: Macroscopic disease score. The disease activity index consist of a combination of body weight loss, loose stool and visible fecal blood scores divided by 3 at the day of sacrifice; C: Assessment of colonic weight upon sacrifice as an index of disease-related intestinal wall thickening; D: Histological grading of colonic colitis scores. The histology damage score was calculated using the following criteria: percentage of area involved, number of follicle aggregates, edema, fibrosis, erosion/ulceration, crypt loss, and infiltration of mononuclear and polymorphonuclear cells. Individual mice are depicted; from the AAV5 (CMV-Tregitope 167) pre-treated group an outliner was removed. Animals were withdrawn from the study when their weight loss was > 25% of their original body weight. Overall for the healthy controls, n = 9; AAV5 (CMV-Tregitope 167) treated, n = 6; diseased controls, n = 6, were included in the analysis. The data were analyzed using a 1 way analysis of variance, followed by Dunn’s post hoc test for multiple comparisons. Data are presented as mean ± SD of all the mice. aP < 0.05, bP < 0.01 vs PBS (diseased control group).
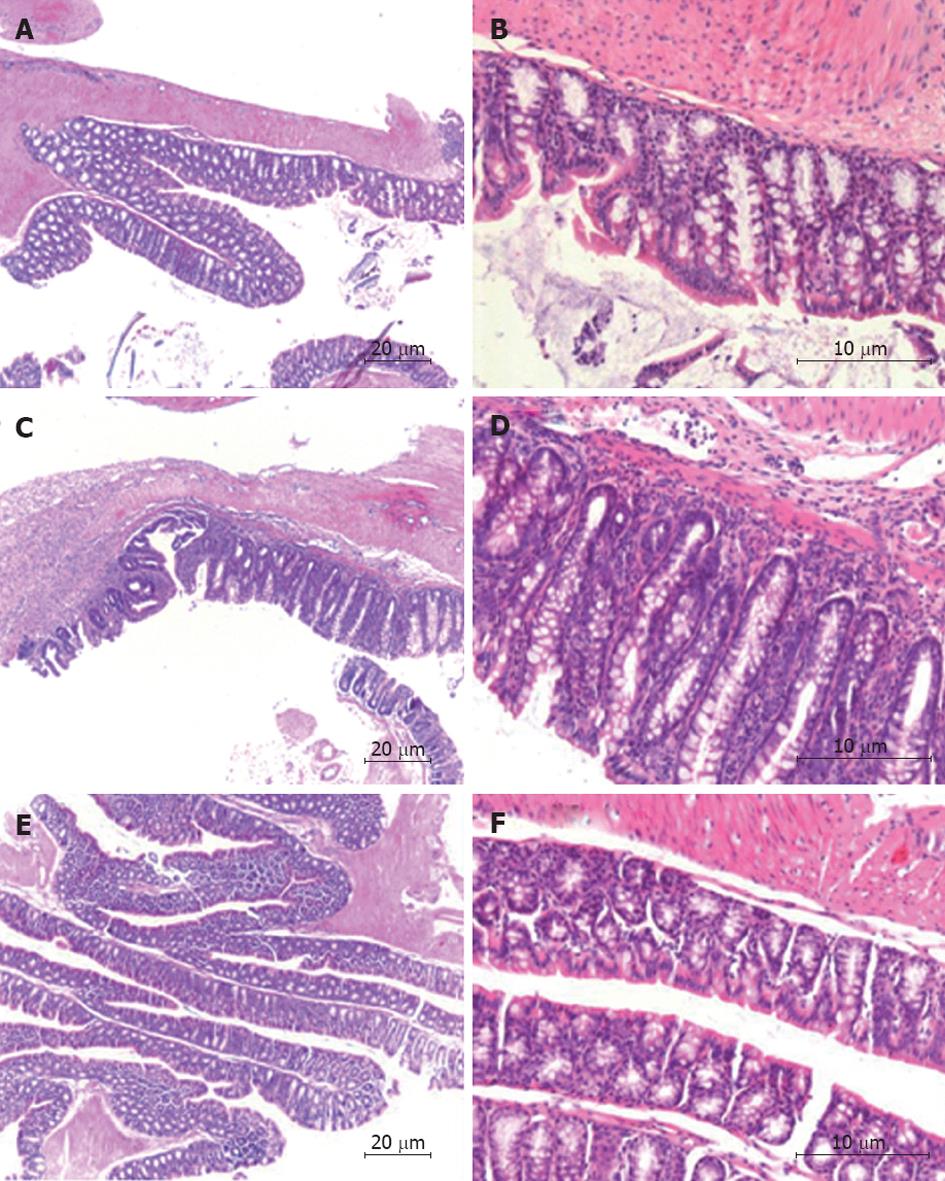
Figure 4 Hematoxylin and eosin-stained paraffin section from colon tissue.
A, B: Healthy control mice; C, D: Diseased control mice; E, F: Adeno associated virus (AAV) 5 [cytomegalovirus (CMV) promoter T-cell epitopes (Tregitope) 167] pre-treated mice. Histological evidence that AAV5 (CMV-Tregitope 167) ameliorates trinitrobenzene sulfonate (TNBS)-induced pathology. Images depicted of an HE-stained paraffin section of a representative mouse colon from each group at the moment of sacrifice. The images of the diseased control (C, D) demonstrated acute inflammation: elongated villi, abundant transmural cellular infiltrate, erosions and crypt loss as compared to both the AAV5 (CMV-Tregitope 167) pre-treated and healthy control mice.
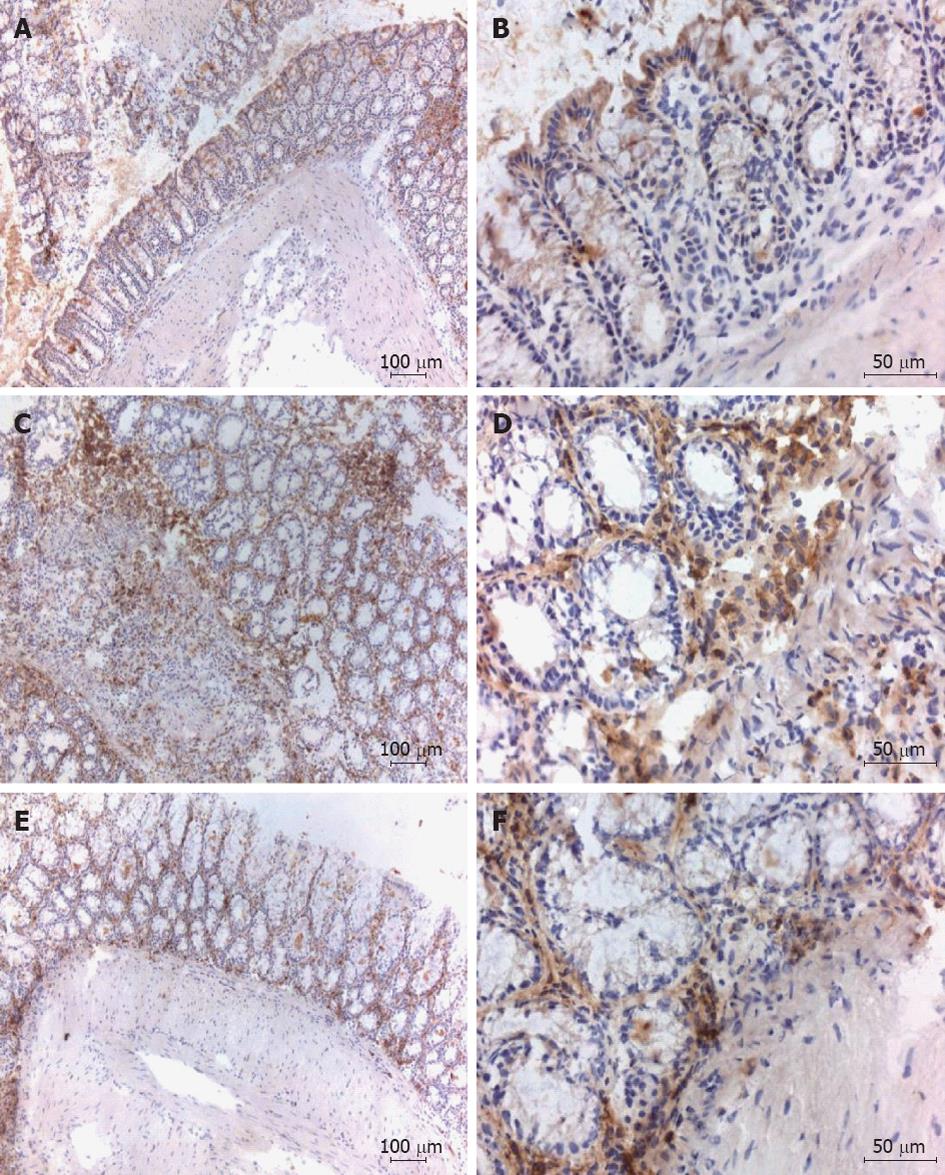
Figure 5 Immunohistochemistry pictures depicting CD4 staining colon tissue.
A, B: Healthy control mice; C, D: Diseased control mice; E, F: Adeno associated virus (AAV) 5 [cytomegalovirus (CMV) promoter T-cell epitopes (Tregitope) 167] pre-treated mice. Specific immunohistochemical staining showed inflammatory cell infiltrates present in trinitrobenzene sulfonate (TNBS) treated mice with or without administration with Tregitope 167 consisted of CD4 positive cells, localized in the sub-epithelial layer, in the lamina propria (C-F) and for the diseased control also in the muscular layer (C,D). Depicted are representative data from a single mouse.
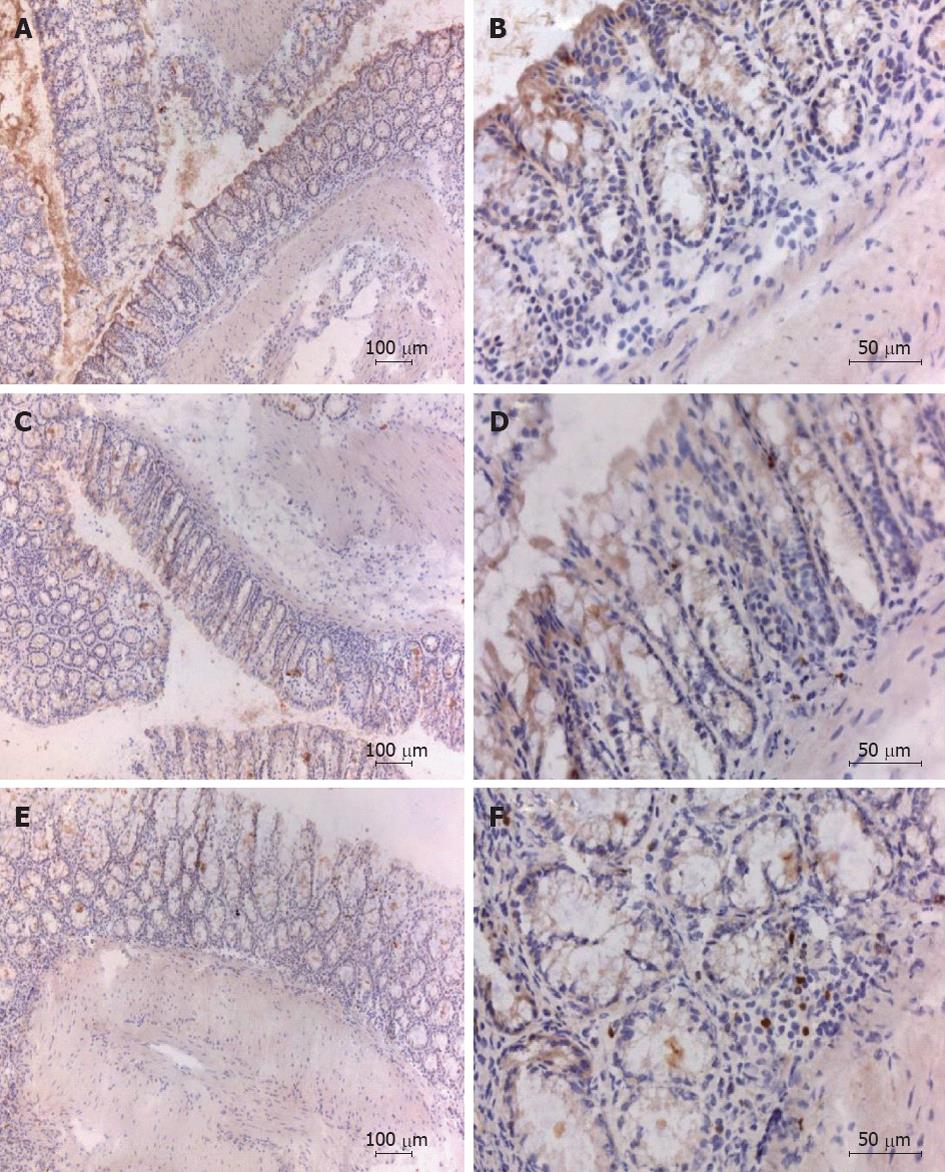
Figure 6 Immunohistochemistry pictures depicting forkhead Box-P3 staining colon tissue.
A, B: Healthy control mice; C, D: Diseased control mice; E, F: Adeno associated virus (AAV) 5 [cytomegalovirus-regulatory (CMV) promoter T-cell epitopes (Tregitope) 167] pre-treated mice. Colon tissue were prepared and assessed by immunohistochemistry for the expression of the transcription factor forkhead Box-P3 (Foxp3) as a marker for regulatory T cells. Numerous Foxp3 positive cells were detected in the lamina propria and sub-epithelium of the colon sections from mice treated with Tregitope 167 (E, F). Foxp3 positive cells were rarely present in the colon of healthy and diseased control mice (A-D). Depicted are representative data from a single mouse.
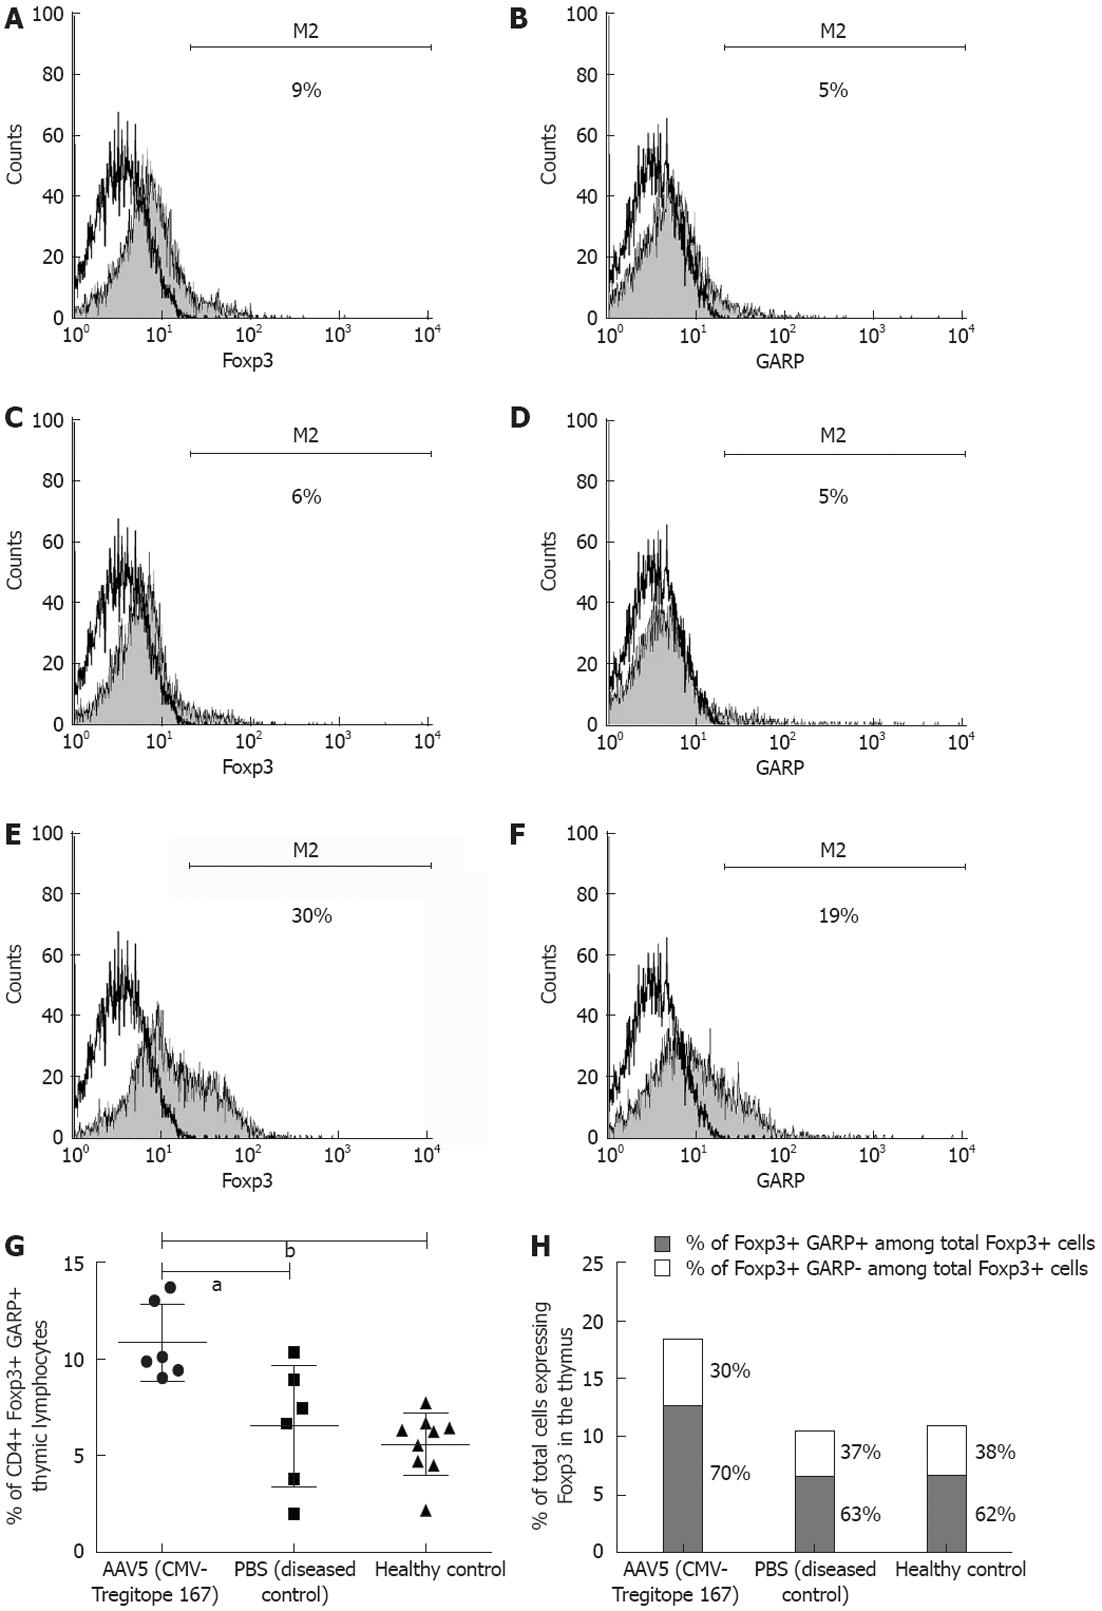
Figure 7 Adeno associated virus serotype 5 mediated delivery of regulatory T-cell epitope 167 induces forkhead Box-P3 and glycoprotein A repetitions predominant expression in the CD4 positive thymic lymphocyte population.
Thymus tissue was collected upon sacrifice. Cells suspensions were prepared and stained for the following markers: CD4, glycoprotein A repetitions predominant (GARP) and forkhead Box-P3 (Foxp3) before analysis by flow cytometry (FACSCalibur, BD Biosciences). A: Histogram Foxp3 cell count: healthy control; B: Histogram GARP cell count: healthy control; C: Histogram Foxp3 cell count: diseased control; D: Histogram GARP cell count: diseased control; E: Histogram Foxp3 cell count: adeno associated virus (AAV) 5 [cytomegalovirus (CMV) promoter T-cell epitopes 167] pre-treated group (grey, filled in) vs unstained control (black continuous line). Gating was done on the CD4 positive thymic lymphocyte population. Depicted are representative data from a single mouse; F: Histogram GARP cell count: AAV5 (CMV-Tregitope 167) pre-treated group (grey, filled in) vs unstained control (black continuous line). Gating was done on the CD4 positive thymic lymphocyte population. Depicted are representative data from a single mouse; G: Depicted are percentages of CD4 positive, Foxp3 positive and GARP positive thymic lymphocytes. Individual mice are depicted; for the a AAV5 (CMV-Tregitope 167) pre-treated group one mouse did not have a thymus and therefore n = 6 mice were included in this analysis. The data were analyzed using a 1 way analysis of variance, followed by Dunn’s post hoc test for multiple comparisons. Data are presented as mean ± SD of all the mice. aP < 0.05, bP < 0.01 vs phosphate-buffered saline (PBS) (diseased control group) or healthy control; H: Both the relative and absolute number of Foxp3 expressing T cells were expanded in the thymus after AAV5 (CMV-Tregitope 167) pre-treatment. Mean % of lymphocytes expressing Foxp3 in the thymus of the three groups are depicted; for the AAV5 (CMV-Tregitope 167) pre-treated group one mouse did not have a thymus and therefore n = 6 mice were included in this analysis.
- Citation: van der Marel S, Majowicz A, Kwikkers K, van Logtenstein R, te Velde AA, De Groot AS, Meijer SL, van Deventer SJ, Petry H, Hommes DW, Ferreira V. Adeno-associated virus mediated delivery of Tregitope 167 ameliorates experimental colitis. World J Gastroenterol 2012; 18(32): 4288-4299
- URL: https://www.wjgnet.com/1007-9327/full/v18/i32/4288.htm
- DOI: https://dx.doi.org/10.3748/wjg.v18.i32.4288


