Copyright
©2012 Baishideng Publishing Group Co.
World J Gastroenterol. Aug 14, 2012; 18(30): 3977-3991
Published online Aug 14, 2012. doi: 10.3748/wjg.v18.i30.3977
Published online Aug 14, 2012. doi: 10.3748/wjg.v18.i30.3977
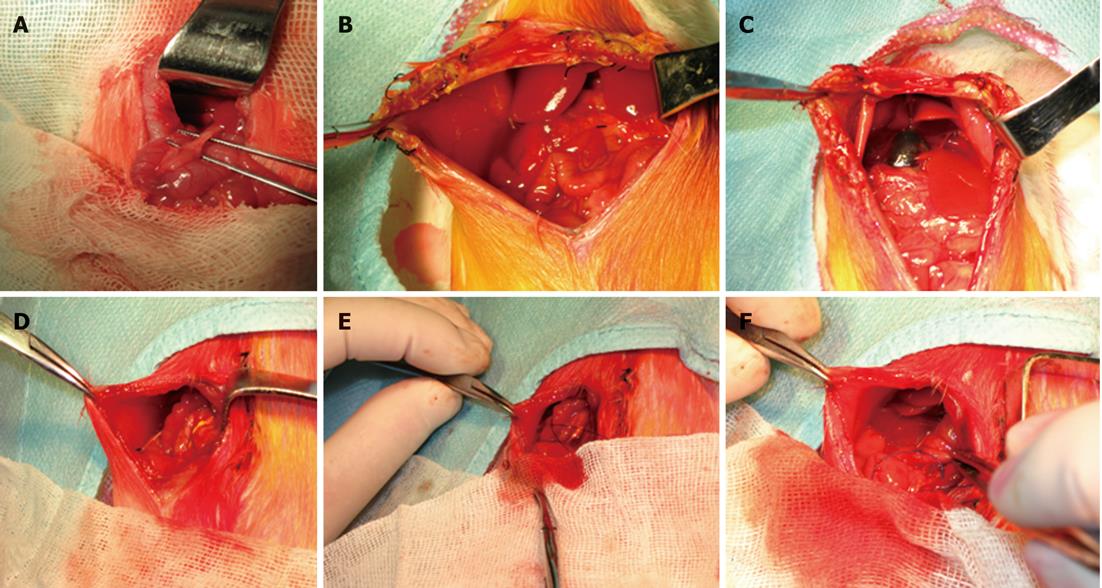
Figure 1 Images of experimental obstructive jaundice and internal biliary drainage.
A: Dissection revealing the common bile duct; B: Reoperation after 3 d of common bile duct ligation. Light yellow abdominal ascites were present in the right side of the abdominal cavity; C: The proximal bile duct showed a remarkable expansion (dark blue color) after 3 d of common bile duct ligation; D: The PE-10 polyethylene tube was positioned with the end tied in the right hepatorenal recess; E: Brown bile flowed out while the catheter end was open; F: The distal 3 cm segment of the catheter was inserted into the duodenum for internal biliary drainage.
Figure 2 Light microscopic micrographs of samples stained with haematoxylin and eosin.
A: Normal structure of villi (two-way arrow); B: Blunting of villi (short arrow); C: Existing subepithelial edema (longf arrow) and the lymphocyte and plasma cell infiltration (L). Images shown represent at least three regions observed on the same slide.
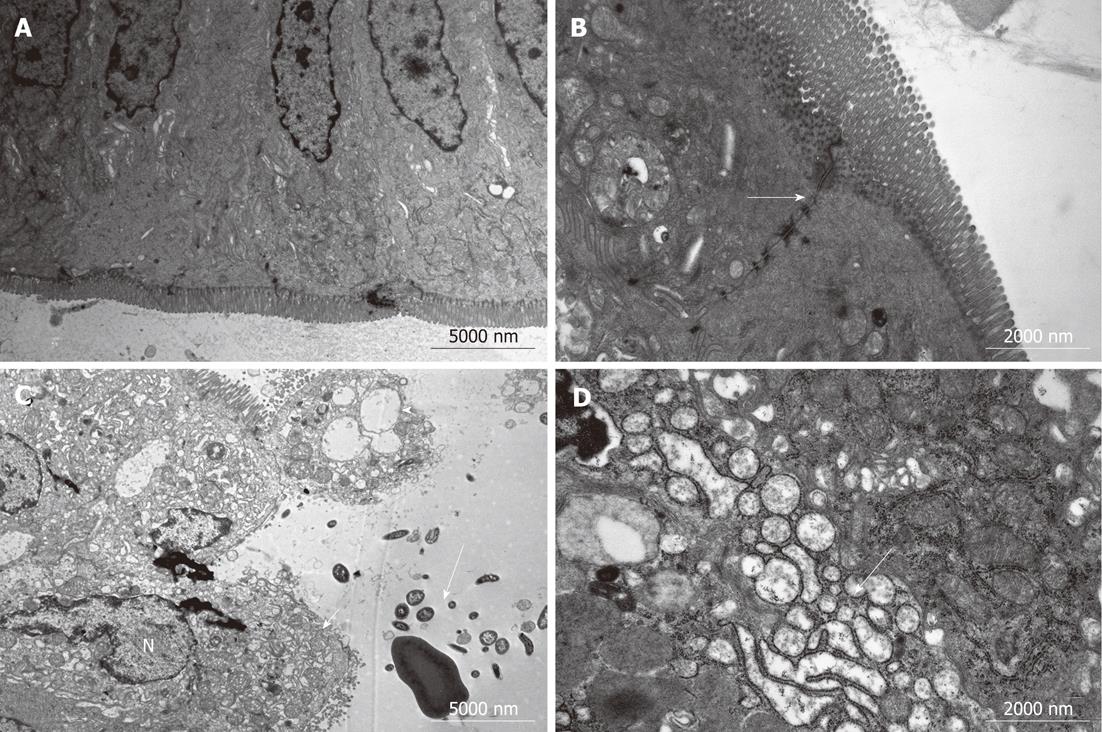
Figure 3 Ultrastructural assessment of enterocytes in the terminal ileum.
A: Normal cell ultrastructure; B: The positions of tight junctions (arrow) and desmosomes; C: Enterocytes showed vacuolar degeneration (short arrow) and mitochondrial swelling, disruption of their microvilli (arrowhead), large dense secondary lysosomes, complete loss of the junctional specialization between adjacent cells (long arrow), and karyopyknosis (N); D: Expansion of the endoplasmic reticulum (arrow). Images shown represent at least three regions observed on the same slide. Group I : Sham-operation; Group II: Bile duct ligation (BDL); Group III: BDL + Lactobacillus plantarum (L. plantarum); Group IV: BDL + internal biliary drainage (IBD); Group V: BDL + IBD + L. plantarum.
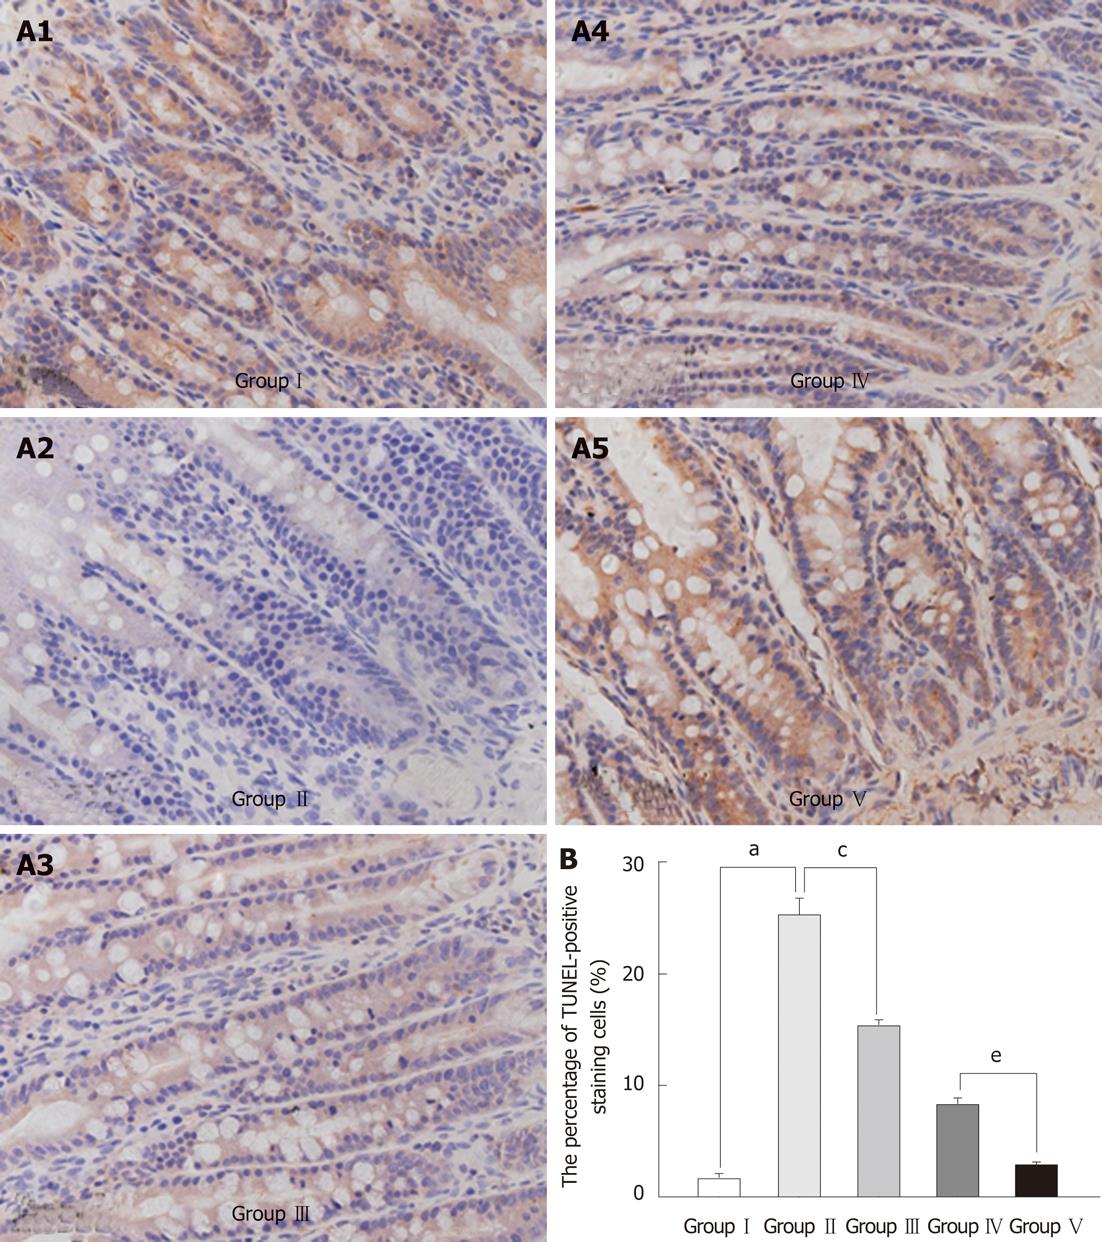
Figure 4 Effects of Lactobacillus plantarum on the apoptosis in the intestinal mucosal epithelium.
A: Ileum sections from each group stained using the terminal deoxyuridine nick-end labeling (TUNEL) method. TUNEL-positive cells were stained dark brown. A significantly higher number of TUNEL-positive cells was detected in tissues from group II animals compared with group III; and the number of TUNEL-positive cells in group IV was higher than in group V. Images shown represent at least three regions observed on the same slide; B: Statistical evaluation of effects of Lactobacillus plantarum (L. plantarum) on the apoptosis in the intestinal mucosal epithelium. Data in the bar graph represent mean ± SD of a minimum of three slides per group. aP < 0.05 Group I vs Group II; cP < 0.05 Group II vs Group III; eP < 0.05 Group IV vs Group V. Group I : Sham-operation; Group II: Bile duct ligation (BDL); Group III: BDL + L. plantarum; Group IV: BDL + internal biliary drainage (IBD); Group V: BDL + IBD + L. plantarum.
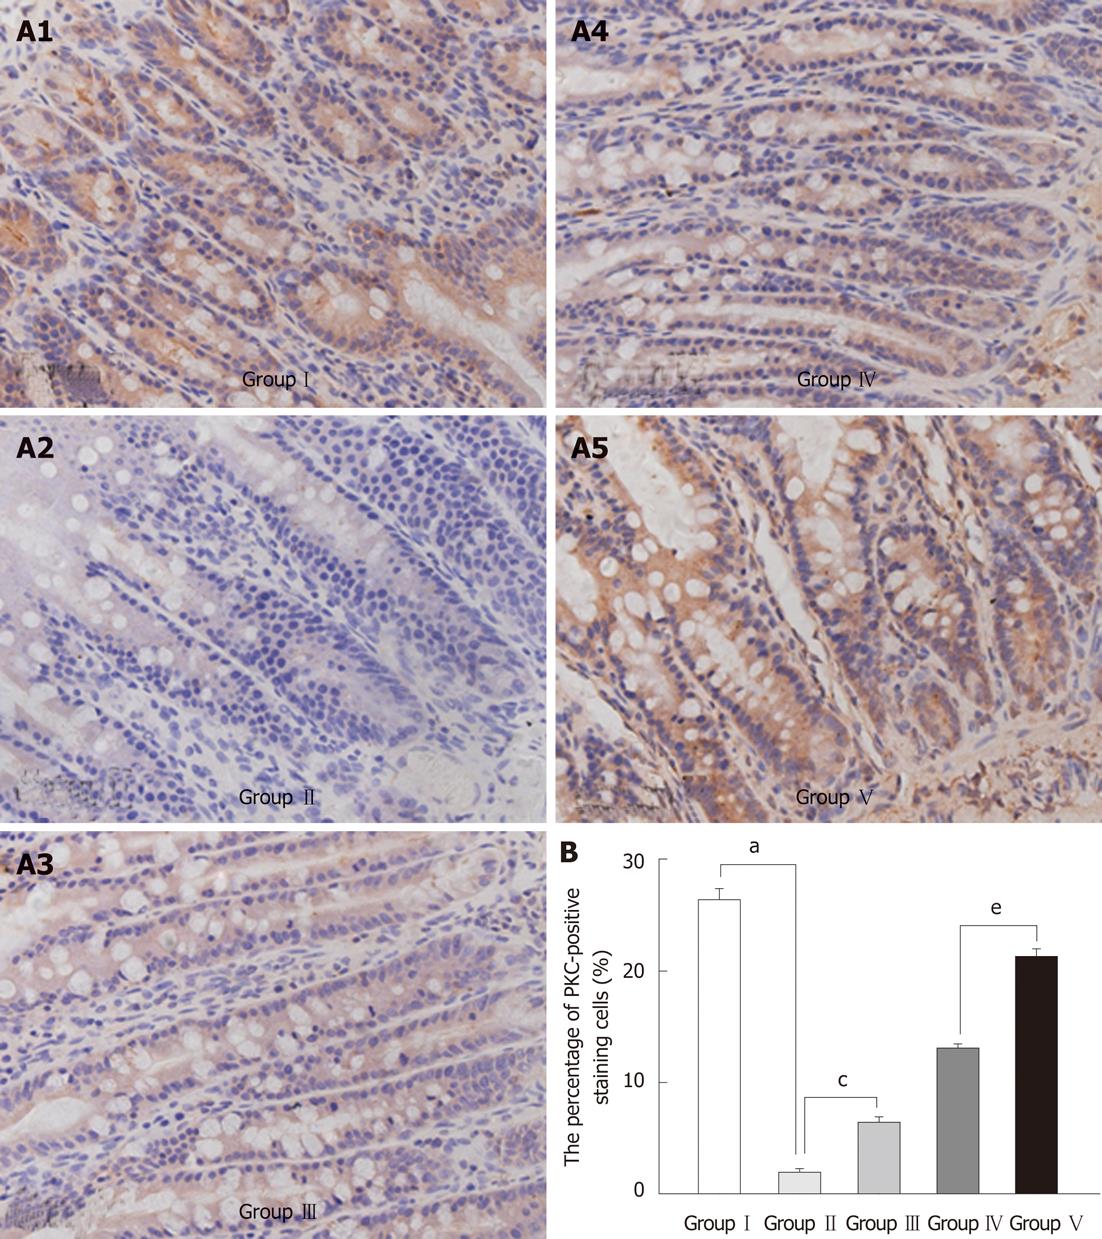
Figure 5 Effects of probiotics on the expression of protein kinase C in the mucosa of the terminal ileum.
A: Probiotics effects on biliary obstruction-induced expression of protein kinase C (PKC) as determined by immunohistochemistry. Images shown are representative of at least three regions observed on the same slide; B: Statistical evaluation of effects of addition of probiotics (Lactobacillus plantarum) on the expression of PKC in the intestinal mucosal epithelium. Data in the bar graph represent mean ± SD of the three separate experiments. aP < 0.05 Group I vs Group II; cP < 0.05Group II vs Group III; eP < 0.05 Group IV vs Group V. Group I : Sham-operation; Group II: Bile duct ligation (BDL); Group III: BDL + Lactobacillus plantarum (L. plantarum); Group IV: BDL + internal biliary drainage (IBD); Group V = BDL + IBD + L. plantarum.
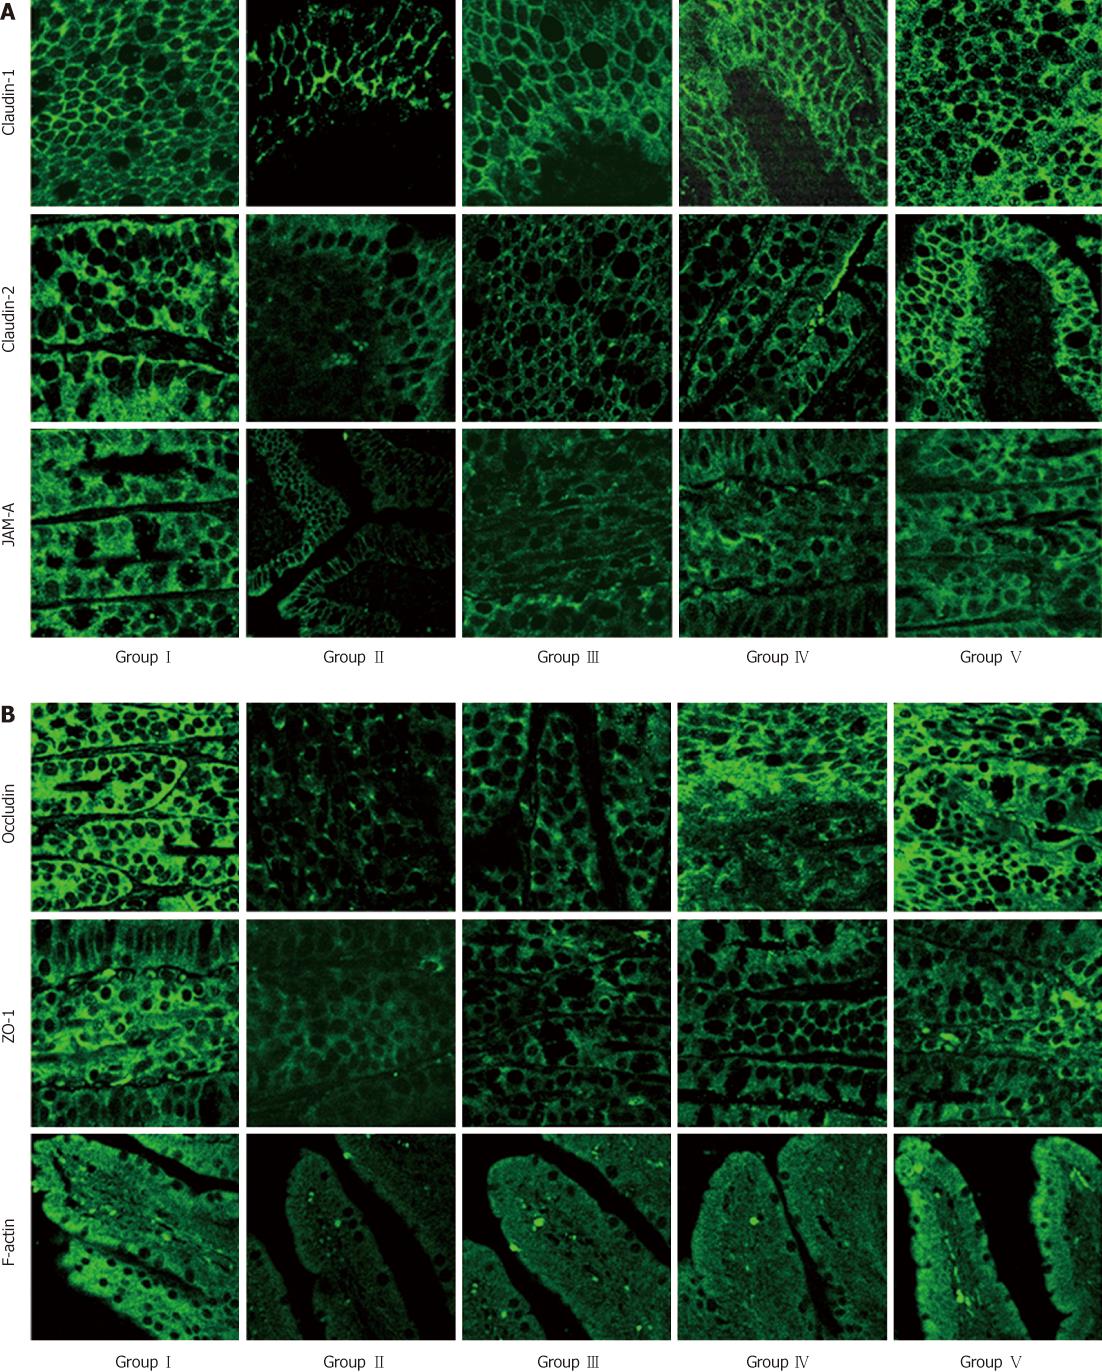
Figure 6 Immunofluorescence expression of claudin-1, claudin-4 and junction adhesion molecule-A (A) and occludin, ZO-1 and F-actin (B) in the mucosa of the terminal ileum.
Images shown are representative of at least three regions observed on the same slide. Group I : Sham-operation; Group II: Bile duct ligation (BDL); Group III: BDL + Lactobacillus plantarum (L. plantarum); Group IV: BDL + internal biliary drainage (IBD); Group V = BDL + IBD + L. plantarum. JAM-A: Junction adhesion molecule-A.
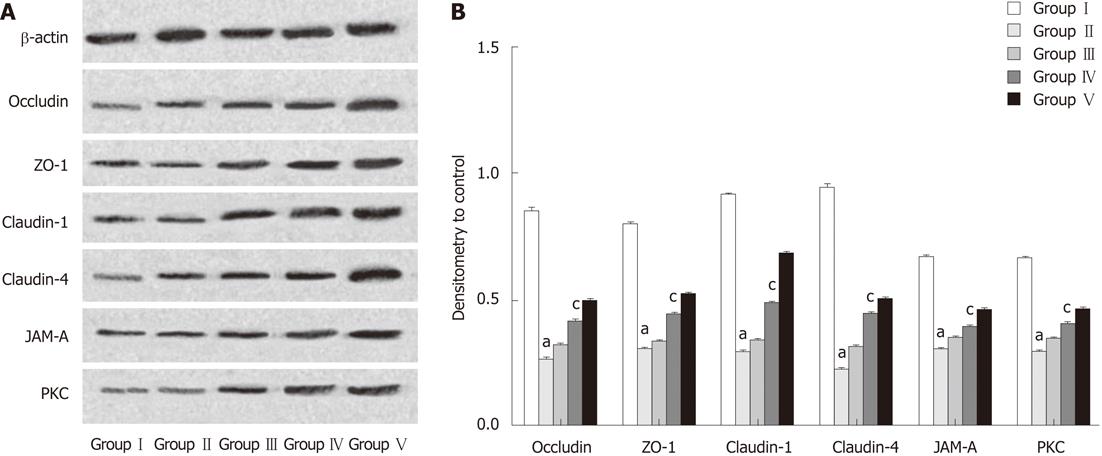
Figure 7 Effects of probiotics on the levels of tight junction proteins and protein kinase C proteins in the mucosa of the terminal ileum.
A: Western blotting analysis of occludin, ZO-1, claudin-1, claudin-4, junction adhesion molecule (JAM)-A, and protein kinase C (PKC) proteins; B: Statistical evaluation of densitometric data that represent protein levels from the three separate experiments. aP < 0.05 vs Group III; cP < 0.05 vs Group V. Data are presented as relative band density ± SD. Group I : Sham-operation; Group II: Bile duct ligation (BDL); Group III: BDL + Lactobacillus plantarum (L. plantarum); Group IV: BDL + internal biliary drainage (IBD); Group V = BDL + IBD + L. plantarum.
Figure 8 Serine phosphorylation of occludin, zonula occludens-1 in the terminal ileum.
Tissue lysates were subjected to immunoprecipitation with the anti-occludin or zonula occludens-1 (ZO-1) antibody, followed by Western blotting analysis with antibodies against phosphoserine. A: p-Occludin and p-ZO-1 protein levels compared with untreated cells; B: Effects of addition of Lactobacillus plantarum on the expression of the p-occludin and p-ZO-1 proteins as shown by relative band density. Data in the bar graph represent mean ± SD of the three separate experiments. aP < 0.05 Group II vs Group III; cP < 0.05 Group IV vs Group V. Group I : Sham-operation; Group II: Bile duct ligation (BDL); Group III: BDL + Lactobacillus plantarum (L. plantarum); Group IV: BDL + internal biliary drainage (IBD); Group V: BDL + IBD + L. plantarum.
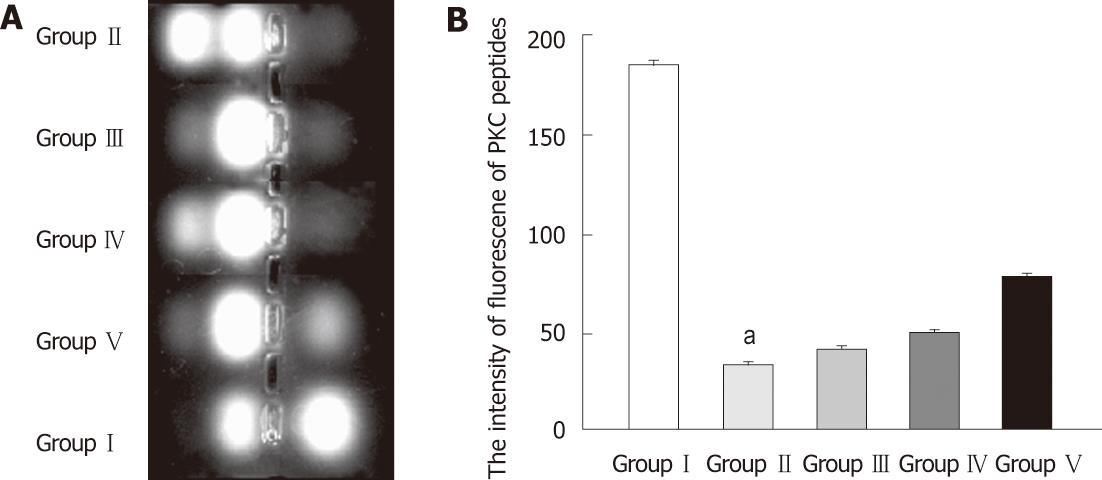
Figure 9 Effect of obstructive jaundice and probiotics on the activity of protein kinase C in the terminal ileum.
A: A representative electrophoresis gel from the protein kinase C (PKC) activity assay; B: The averaged figures in each group of terminal ileum from the three separate experiments. aP < 0.05 vs each of the other four groups. Group I : Sham-operation; Group II: Bile duct ligation (BDL); Group III: BDL + Lactobacillus plantarum (L. plantarum); Group IV: BDL + internal biliary drainage (IBD); Group V: BDL + IBD + L. plantarum.
-
Citation: Zhou YK, Qin HL, Zhang M, Shen TY, Chen HQ, Ma YL, Chu ZX, Zhang P, Liu ZH. Effects of
Lactobacillus plantarum on gut barrier function in experimental obstructive jaundice. World J Gastroenterol 2012; 18(30): 3977-3991 - URL: https://www.wjgnet.com/1007-9327/full/v18/i30/3977.htm
- DOI: https://dx.doi.org/10.3748/wjg.v18.i30.3977


