Copyright
©2012 Baishideng Publishing Group Co.
World J Gastroenterol. Aug 14, 2012; 18(30): 3977-3991
Published online Aug 14, 2012. doi: 10.3748/wjg.v18.i30.3977
Published online Aug 14, 2012. doi: 10.3748/wjg.v18.i30.3977
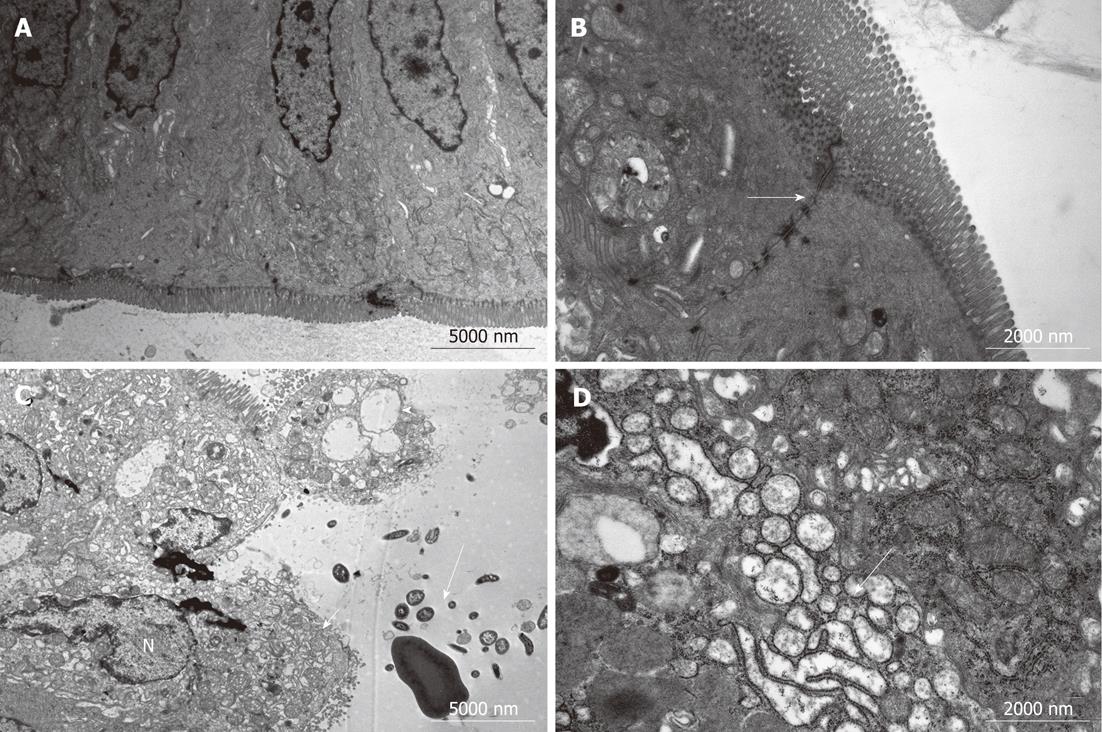
Figure 3 Ultrastructural assessment of enterocytes in the terminal ileum.
A: Normal cell ultrastructure; B: The positions of tight junctions (arrow) and desmosomes; C: Enterocytes showed vacuolar degeneration (short arrow) and mitochondrial swelling, disruption of their microvilli (arrowhead), large dense secondary lysosomes, complete loss of the junctional specialization between adjacent cells (long arrow), and karyopyknosis (N); D: Expansion of the endoplasmic reticulum (arrow). Images shown represent at least three regions observed on the same slide. Group I : Sham-operation; Group II: Bile duct ligation (BDL); Group III: BDL + Lactobacillus plantarum (L. plantarum); Group IV: BDL + internal biliary drainage (IBD); Group V: BDL + IBD + L. plantarum.
-
Citation: Zhou YK, Qin HL, Zhang M, Shen TY, Chen HQ, Ma YL, Chu ZX, Zhang P, Liu ZH. Effects of
Lactobacillus plantarum on gut barrier function in experimental obstructive jaundice. World J Gastroenterol 2012; 18(30): 3977-3991 - URL: https://www.wjgnet.com/1007-9327/full/v18/i30/3977.htm
- DOI: https://dx.doi.org/10.3748/wjg.v18.i30.3977


