Copyright
©2011 Baishideng Publishing Group Co.
World J Gastroenterol. Aug 7, 2011; 17(29): 3420-3430
Published online Aug 7, 2011. doi: 10.3748/wjg.v17.i29.3420
Published online Aug 7, 2011. doi: 10.3748/wjg.v17.i29.3420
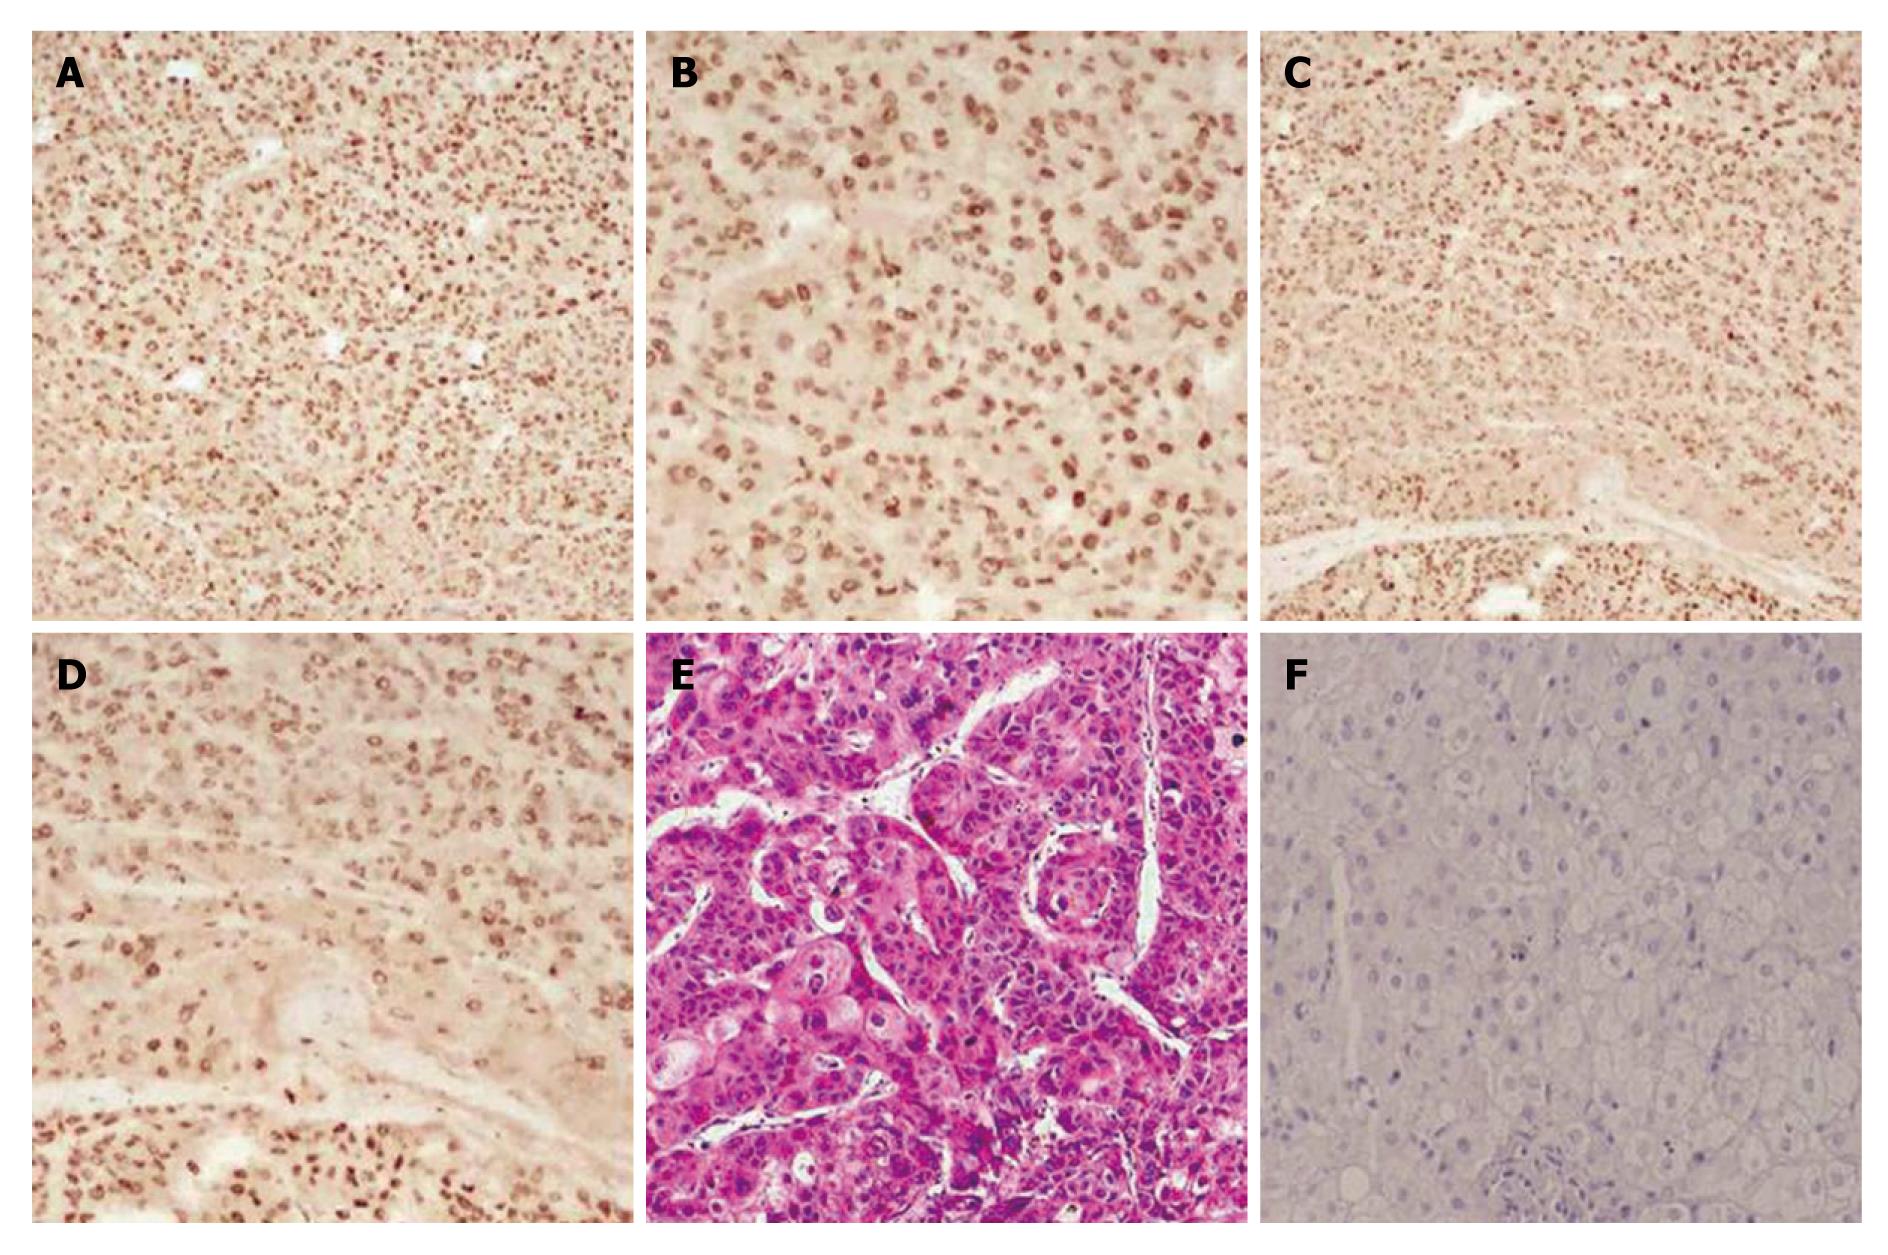
Figure 1 Correlation between late SV40 factor overexpression and aberrant Notch-1 activation in liver cancer.
Liver cancer tissue specimens from 25 patients were analyzed for Notch-1 and late SV40 factor (LSF) expression by immunochemistry. A: Representative sample showing the strong correlation between Notch-1 expression and LSF expression; A and B were labeled with Notch-1 antibody (magnification: A × 10 and B × 20); C and D were labeled with an anti-LSF antibody (magnification: C × 10 and D × 20); E: Liver cancer specimen stained with hematoxylin and eosin; F: Human normal liver tissue specimen labeled with Notch1 and LSF antibodies. Expression is negative (control).
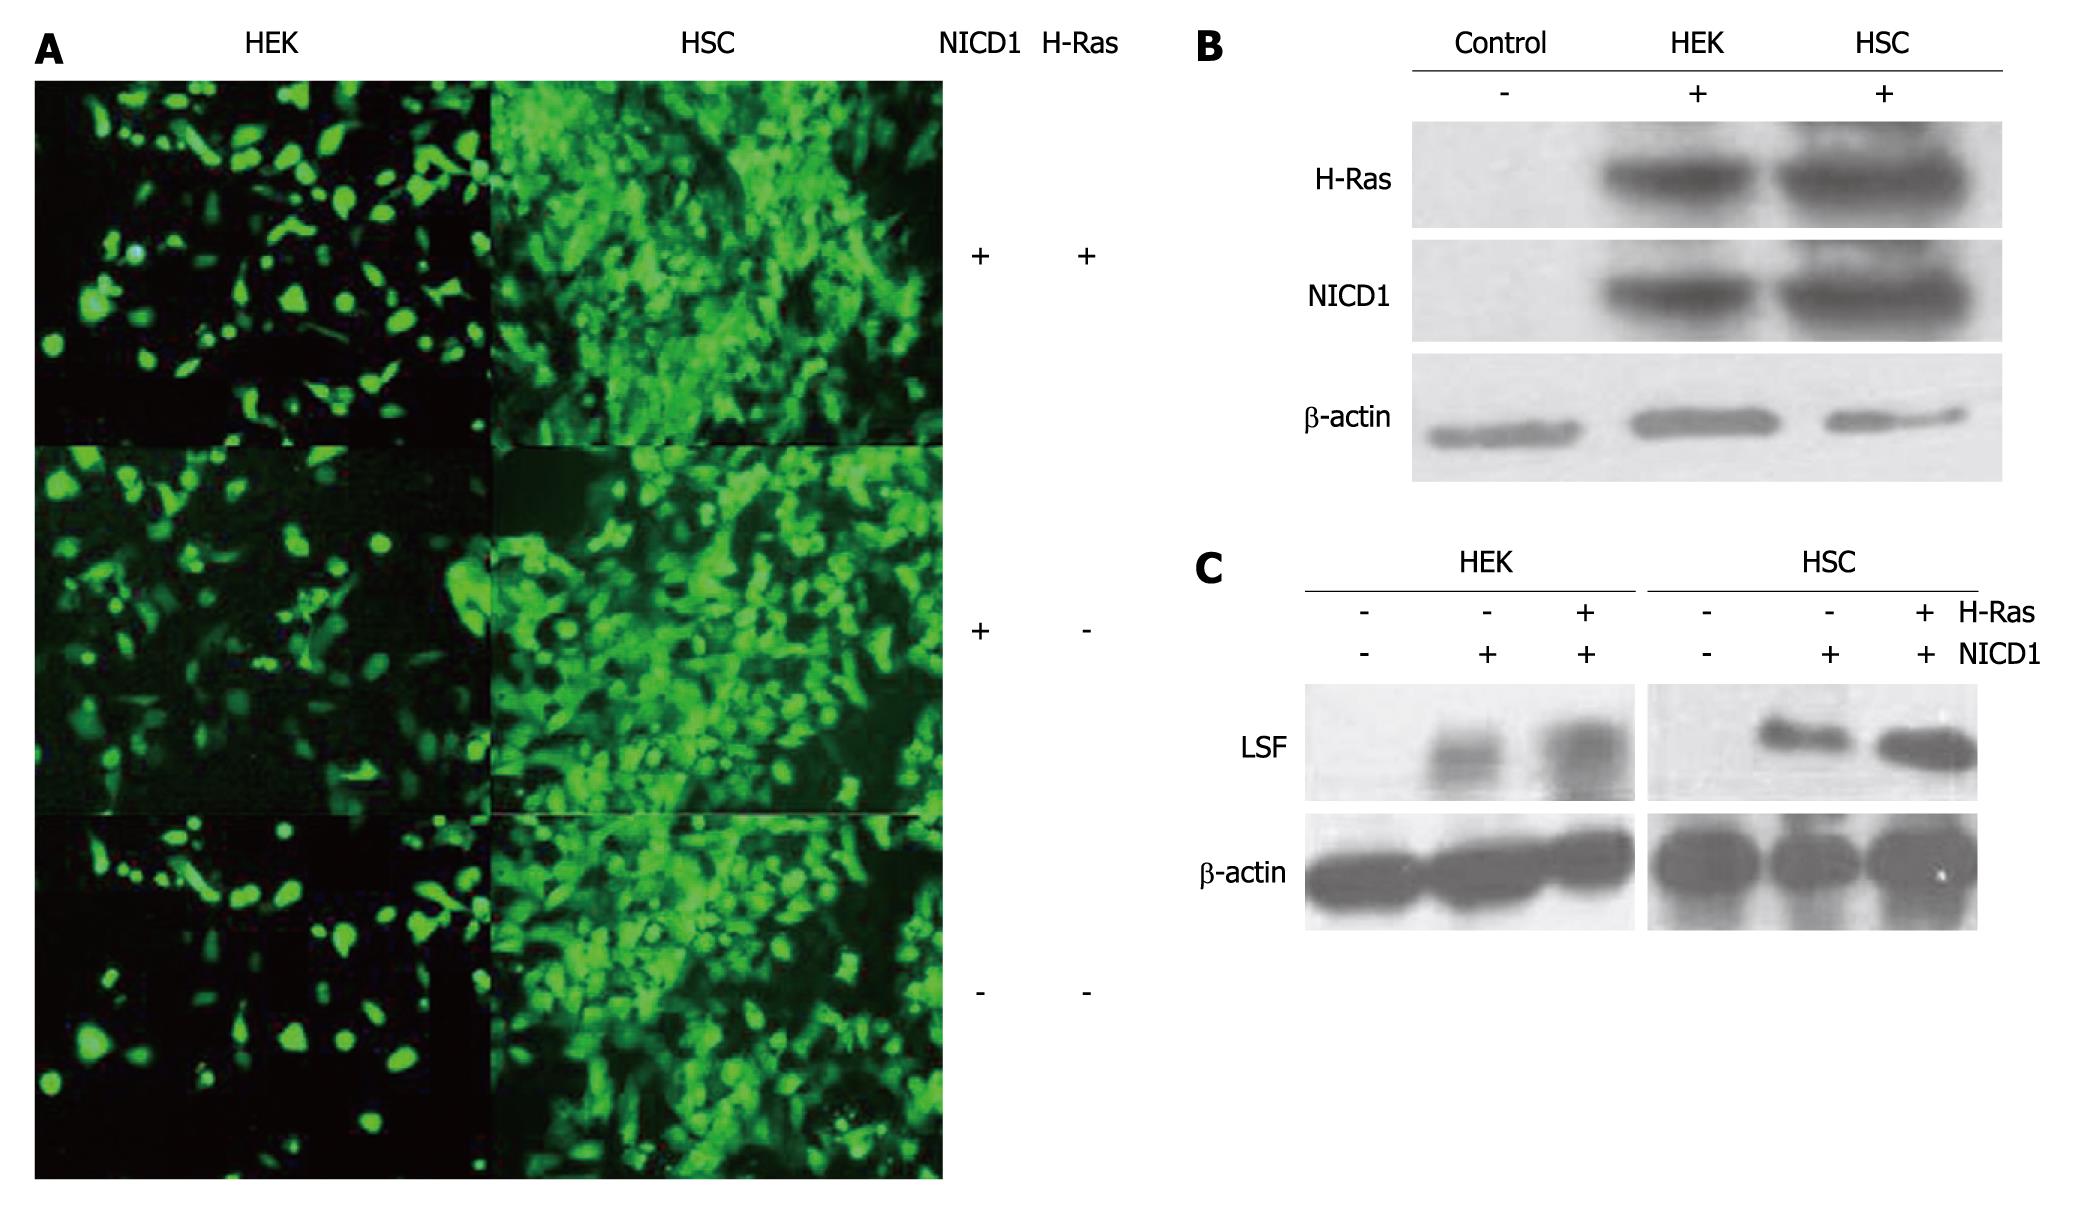
Figure 2 Late SV40 factor expression is increased in human normal cells showing forced overexpression of exogenous Notch1-ICD.
A: Transient transfection of H-Ras and/or NICD1 and stable transfection of H-Ras and/or NICD1 into hepatic stellate cells (HSC); B: Western-blotting analysis of H-Ras and NICD1 from human embryonic kidney (HEK) cells and human HSC; C: Late SV40 factor (LSF)-dependent expression correlates with Notch1-ICD protein levels in human normal cells after forced overexpression of exogenous Notch1-ICD. Co-expression of H-Ras and Notch1-ICD significantly increases LSF levels.
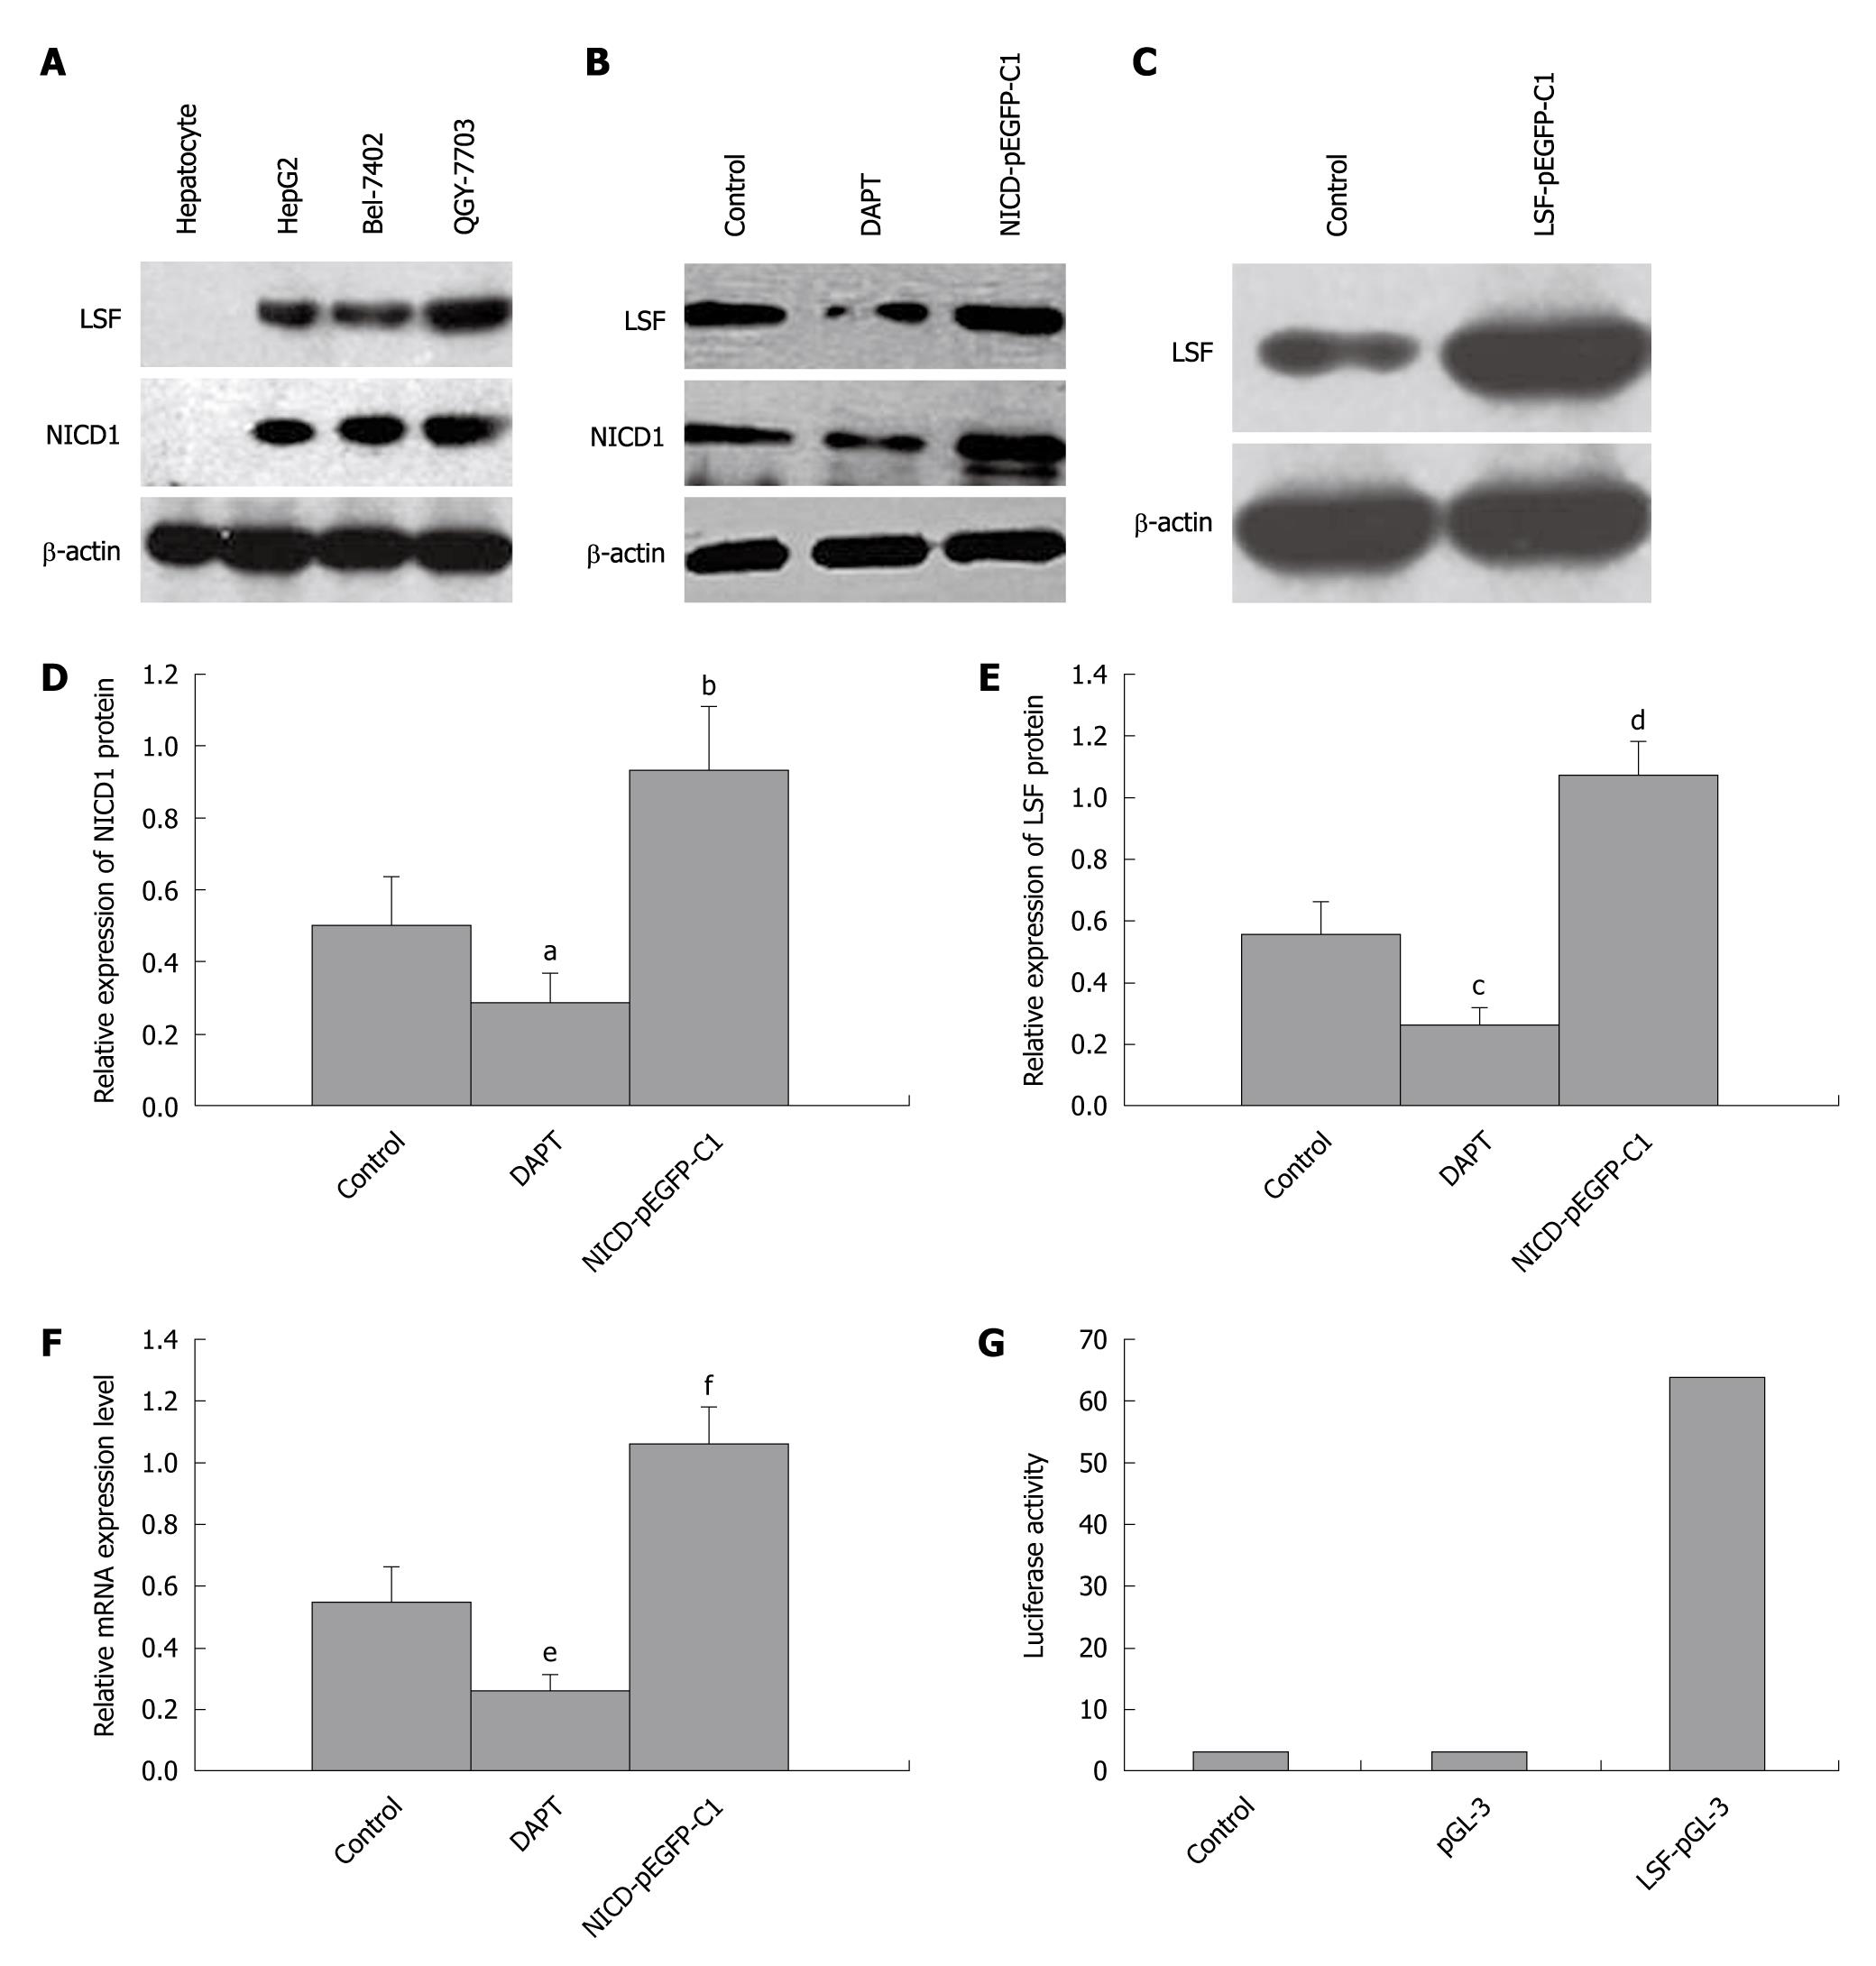
Figure 3 Aberrant Notch-1 activation upregulates late SV40 factor levels in hepatocellular carcinoma cells.
A: Western-blotting analysis of Notch1 and late SV40 factor (LSF) expression in 3 hepatocellular carcinoma (HCC) cell lines. Notch1 and LSF levels are upregulated (hepatocytes were used as the negative control); B: Inhibition of Notch-1 signaling by 50 μmol/L DAPT (a γ secretase inhibitor). Notch1-ICD and LSF levels are significantly decreased compared with those in untreated HepG2 cells; C: Overexpression of exogenous LSF in HepG2 cells. LSF levels are significantly increased compared with those in untreated HepG2 cells. Representative blots are shown from three independent experiments with identical results. β-actin was used as an internal control for equal loading of samples and the relative ratios of each band were normalized to β-actin; D: The mean ± SE of 3 experiments analyzing the relative expression of Notch1-ICD (DAPT group: aP < 0.05, Notch-ICD1 group: bP < 0.05); E: DAPT group: cP < 0.05, Notch-ICD1 group: dP < 0.05; F: Hes-1 mRNA expression levels were determined by semi-quantitative reverse transcription-polymerase chain reaction and mRNA levels were normalized to those of GADPH. Results represent the mean ± SE of 3 independent experiments (DAPT group: eP < 0.05, NICD1 group: fP < 0.05); G: Promoter assay showing an approximately 60-fold increase in LSF reporter activity in hepatic stellate cells (HSC) transfected with NICD1-pEGFP-C1 compared with controls.
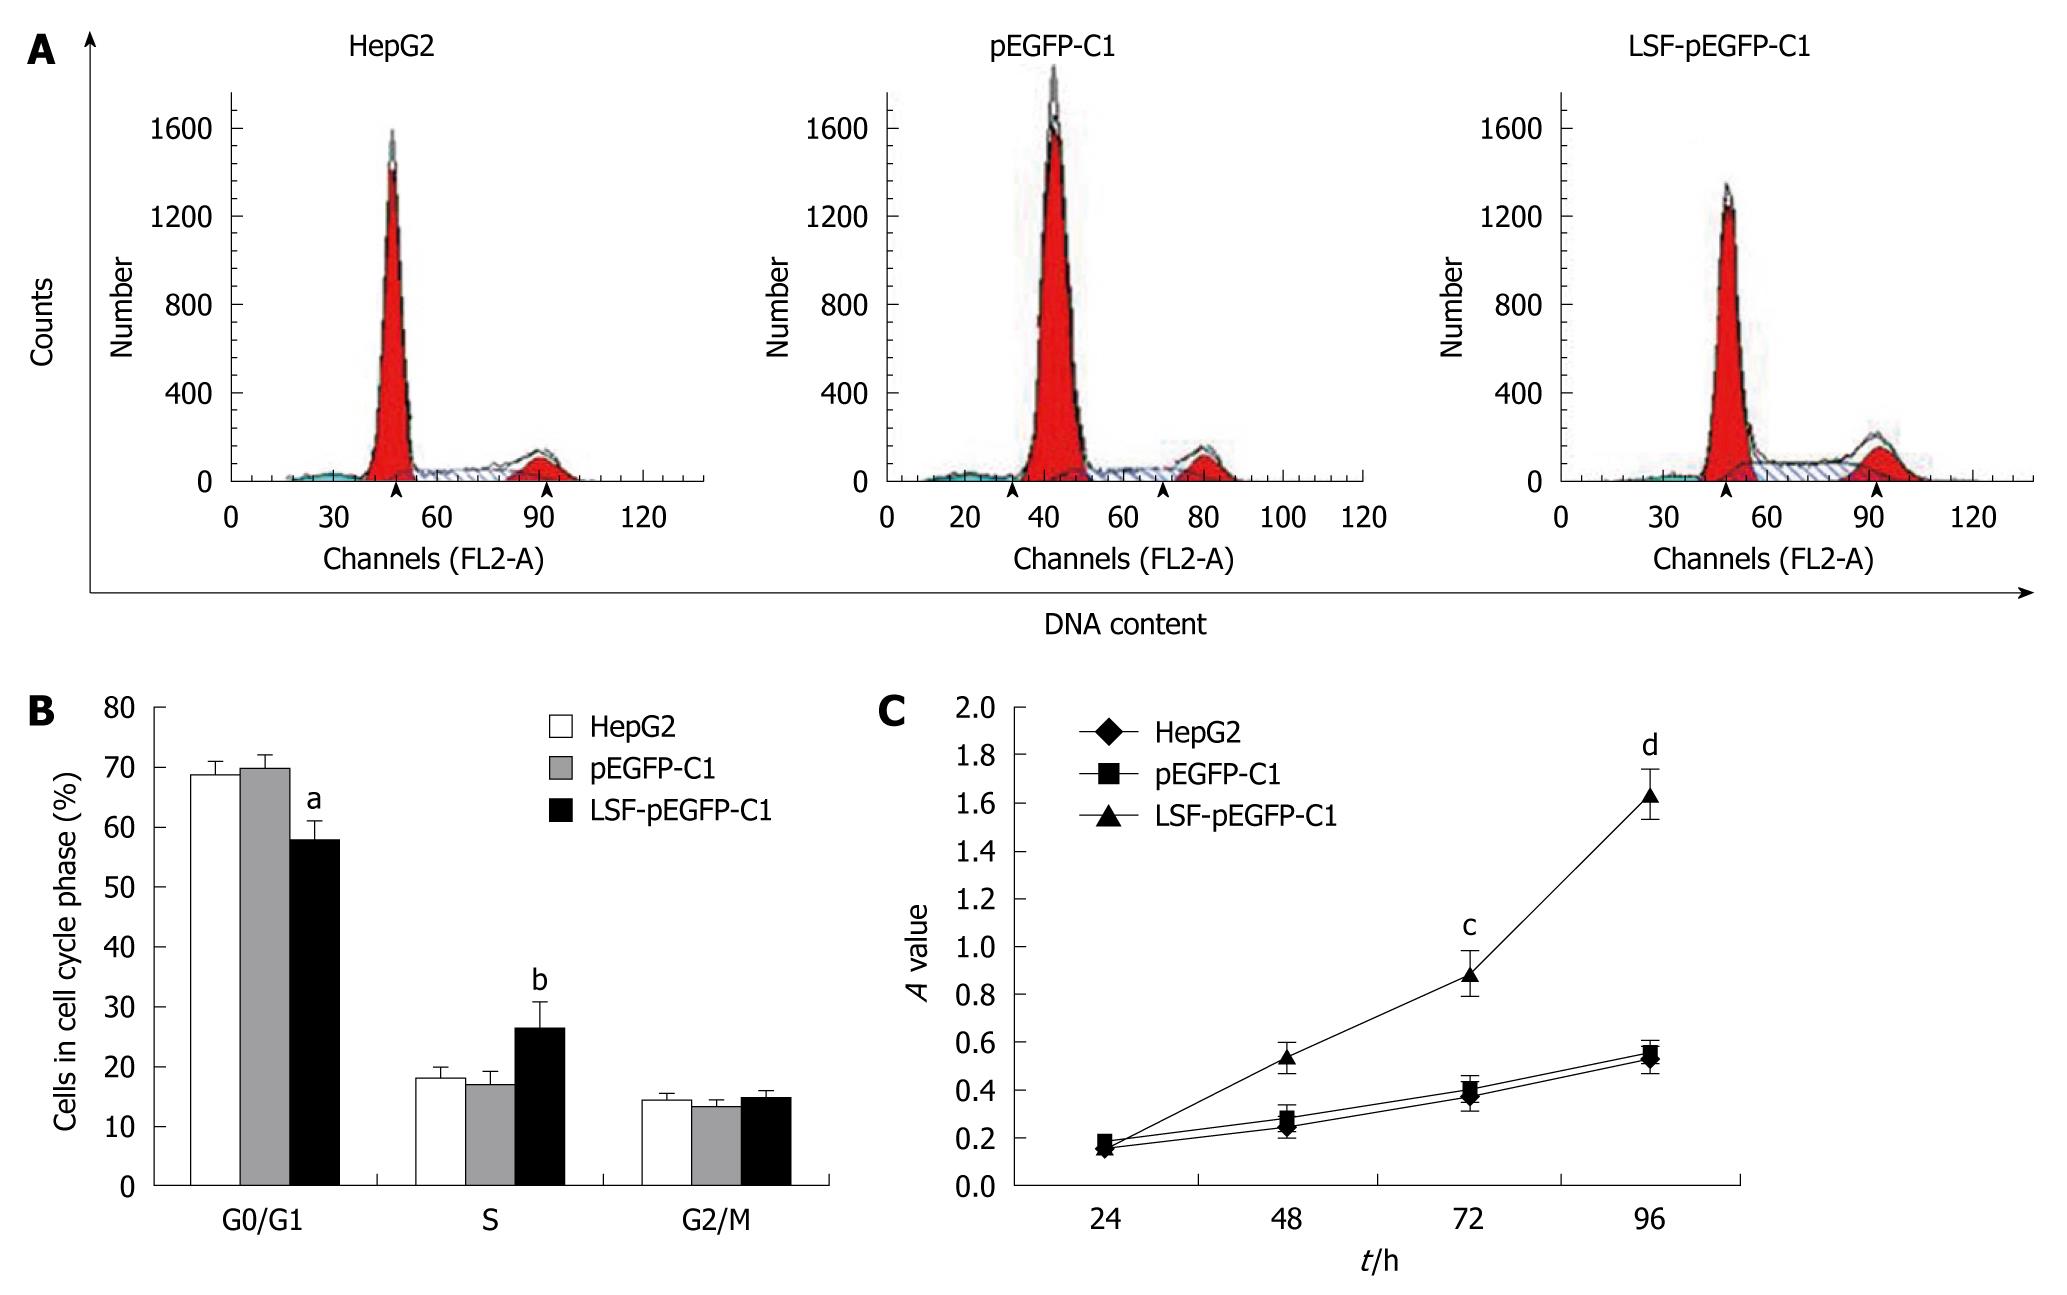
Figure 4 Effects of late SV40 factor overexpression on cell growth and the cell cycle of HepG2 cells.
The cell-cycle profile was determined as the percentage of cells in the G0/G1 stage of the cell-cycle. Untransfected and transfected cells were harvested by trypsinization and fixed in 70% ethanol. A: Results of a representative experiment; B: Mean ± SE of 3 independent experiments (aP < 0.01, bP < 0.01 vs the other groups); C: Cell viability of the indicated cells at the indicated time points measured using a standard 3- (4,5-cimethylthiazol-2-yl)-2,5-diphenyl tetrazolium bromide assay. Data represent the mean ± SE (cP < 0.01, dP < 0.01 vs the other groups).
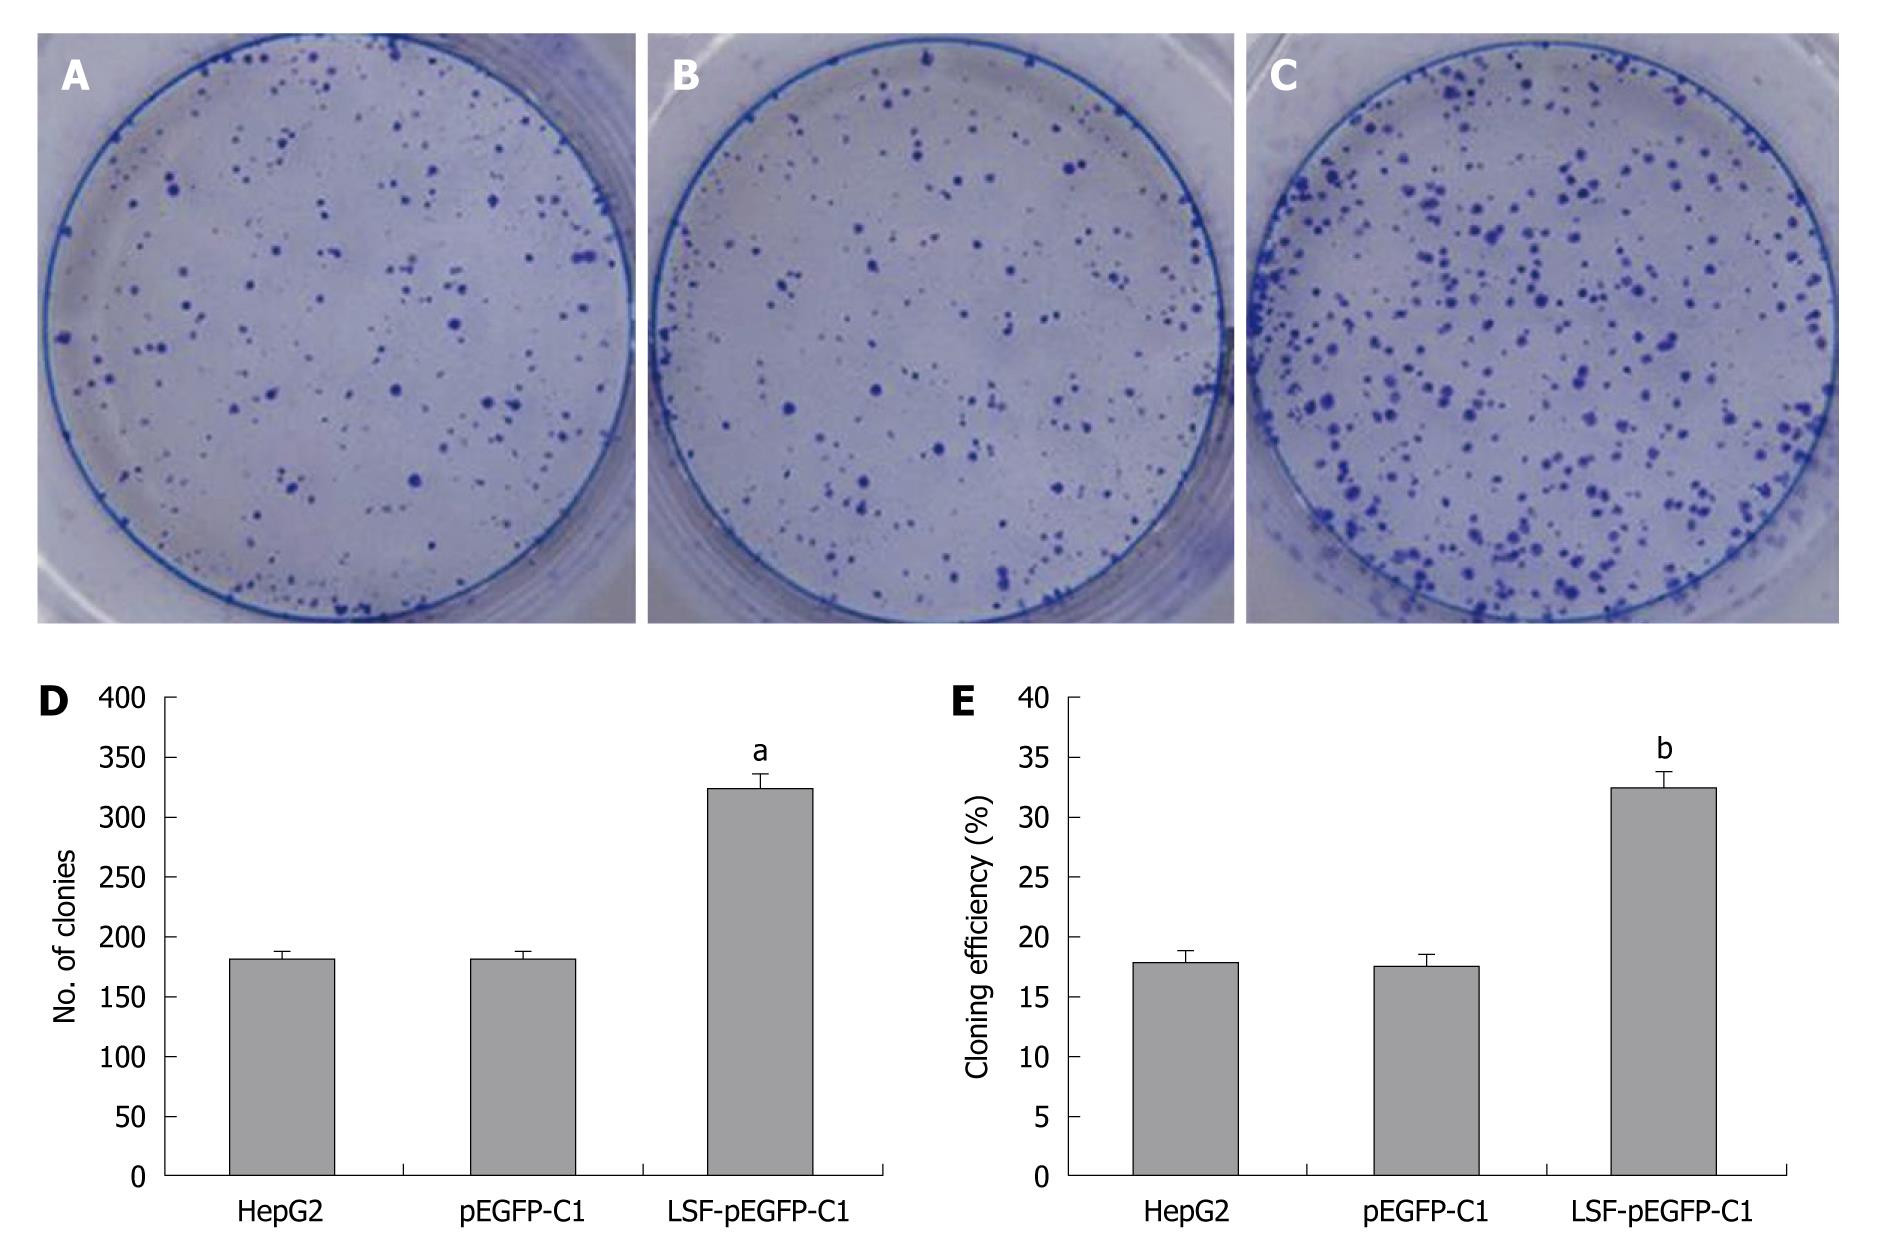
Figure 5 Exogenous late SV40 factor expression increases the proliferation of HepG2 cells.
A: Colony formation assay for uninfected HepG2 cells; B: HepG2 cells transfected with pEGFP-C1; C: HepG2 cells transfected with late SV40 factor (LSF)-pEGFP-C1; D: Colony data represent the mean ± SE (aP < 0.05); E: Clone efficiency data (mean ± SE; bP < 0.05).
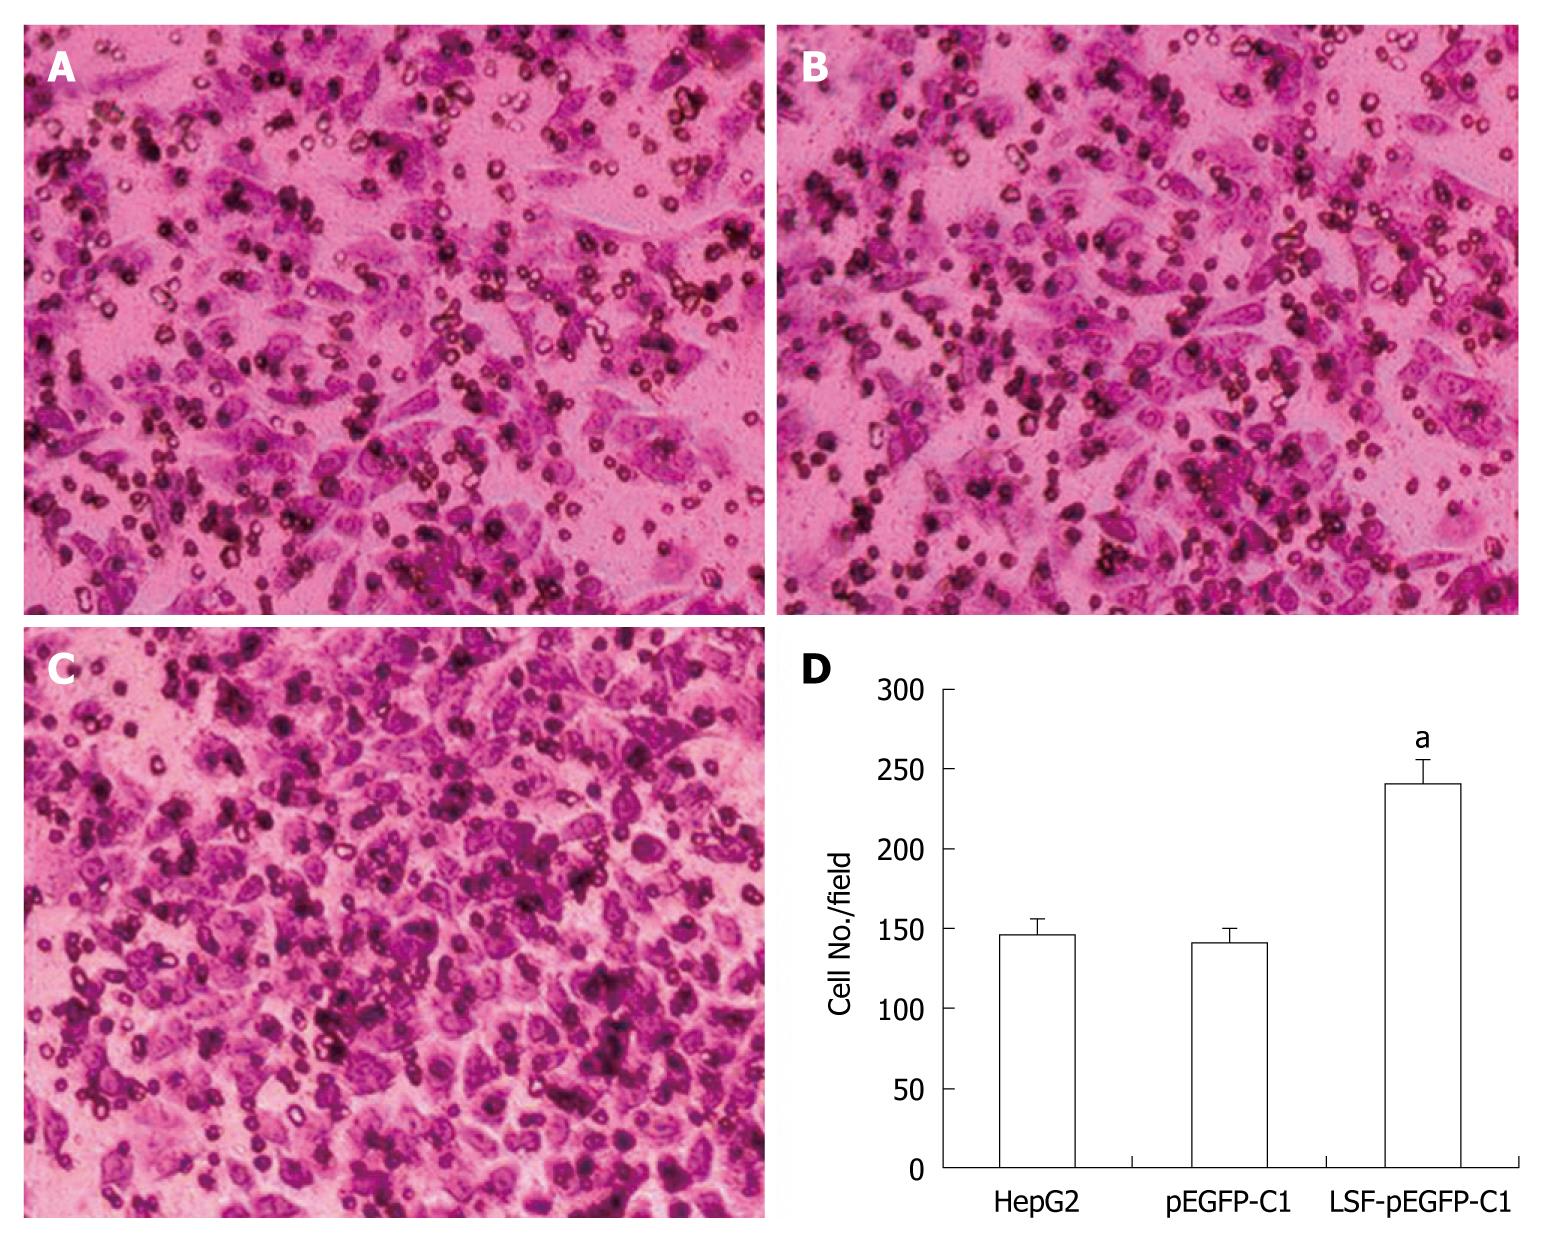
Figure 6 Effects of exogenous late SV40 factor expression on cell invasiveness.
A: Matrigel invasion assay using uninfected HepG2 cells; B: HepG2 cells transfected with pEGFP-C1; C: HepG2 cells transfected with late SV40 factor (LSF)-pEGFP-C1; D: Data represent the mean ± SE (aP < 0.05).
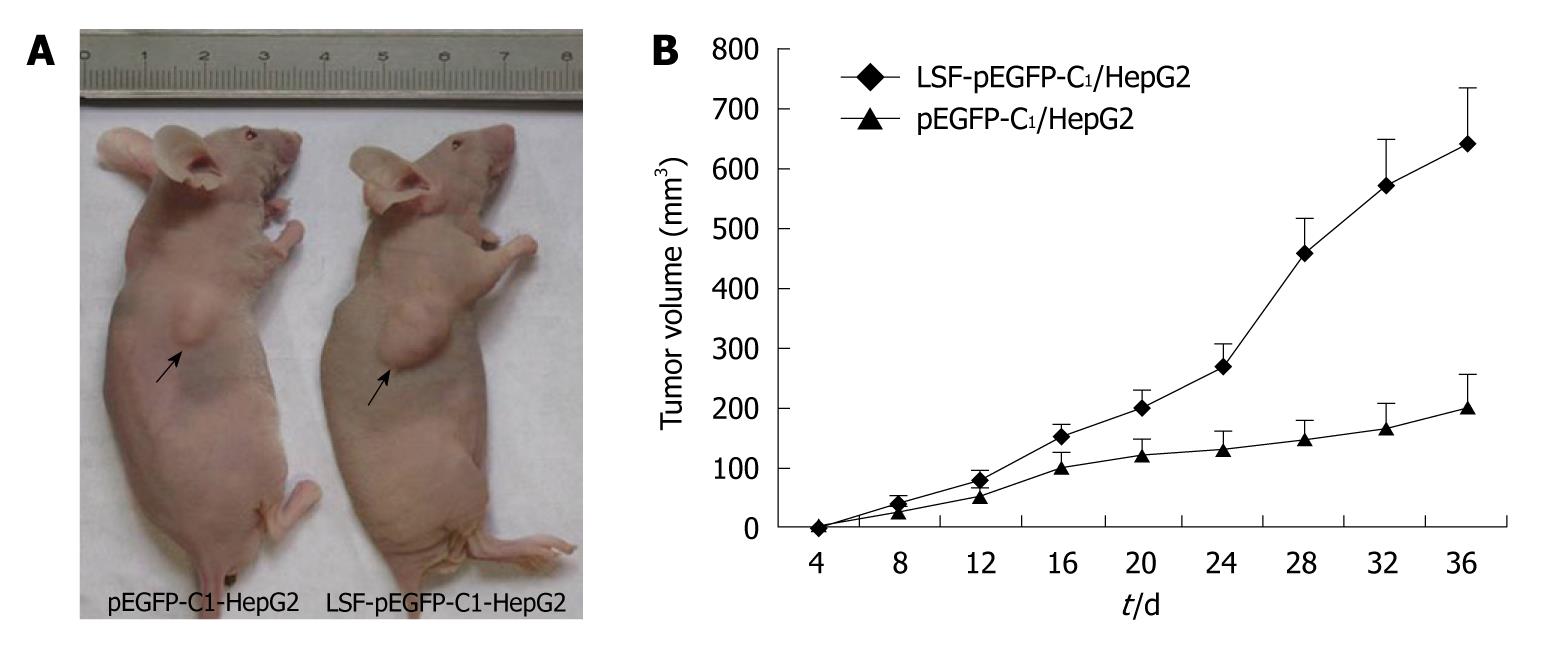
Figure 7 Overexpression of exogenous late SV40 factor increases the growth of HepG2 tumors in vivo.
A: 2 × 10⁶ cells were transfected with the late SV40 factor (LSF)-pEGFP-C1 recombinant vector or the empty vector and injected into nude mice (n = 8). Representative picture of nude mice injected with LSF-pEGFP-C1/HepG2 cells and pEGFP-C1/HepG2 cells (arrow) at week 5; B: The mean tumor volume ± SE (mm3) within each group. The mean tumor volume in the LSF-pEGFP-C1/HepG2 mice (P < 0.01) was significantly larger than that in the empty-vector group.
- Citation: Fan RH, Li J, Wu N, Chen PS. Late SV40 factor: A key mediator of Notch signaling in human hepatocarcinogenesis. World J Gastroenterol 2011; 17(29): 3420-3430
- URL: https://www.wjgnet.com/1007-9327/full/v17/i29/3420.htm
- DOI: https://dx.doi.org/10.3748/wjg.v17.i29.3420


