Copyright
©2011 Baishideng Publishing Group Co.
World J Gastroenterol. Jun 21, 2011; 17(23): 2848-2854
Published online Jun 21, 2011. doi: 10.3748/wjg.v17.i23.2848
Published online Jun 21, 2011. doi: 10.3748/wjg.v17.i23.2848
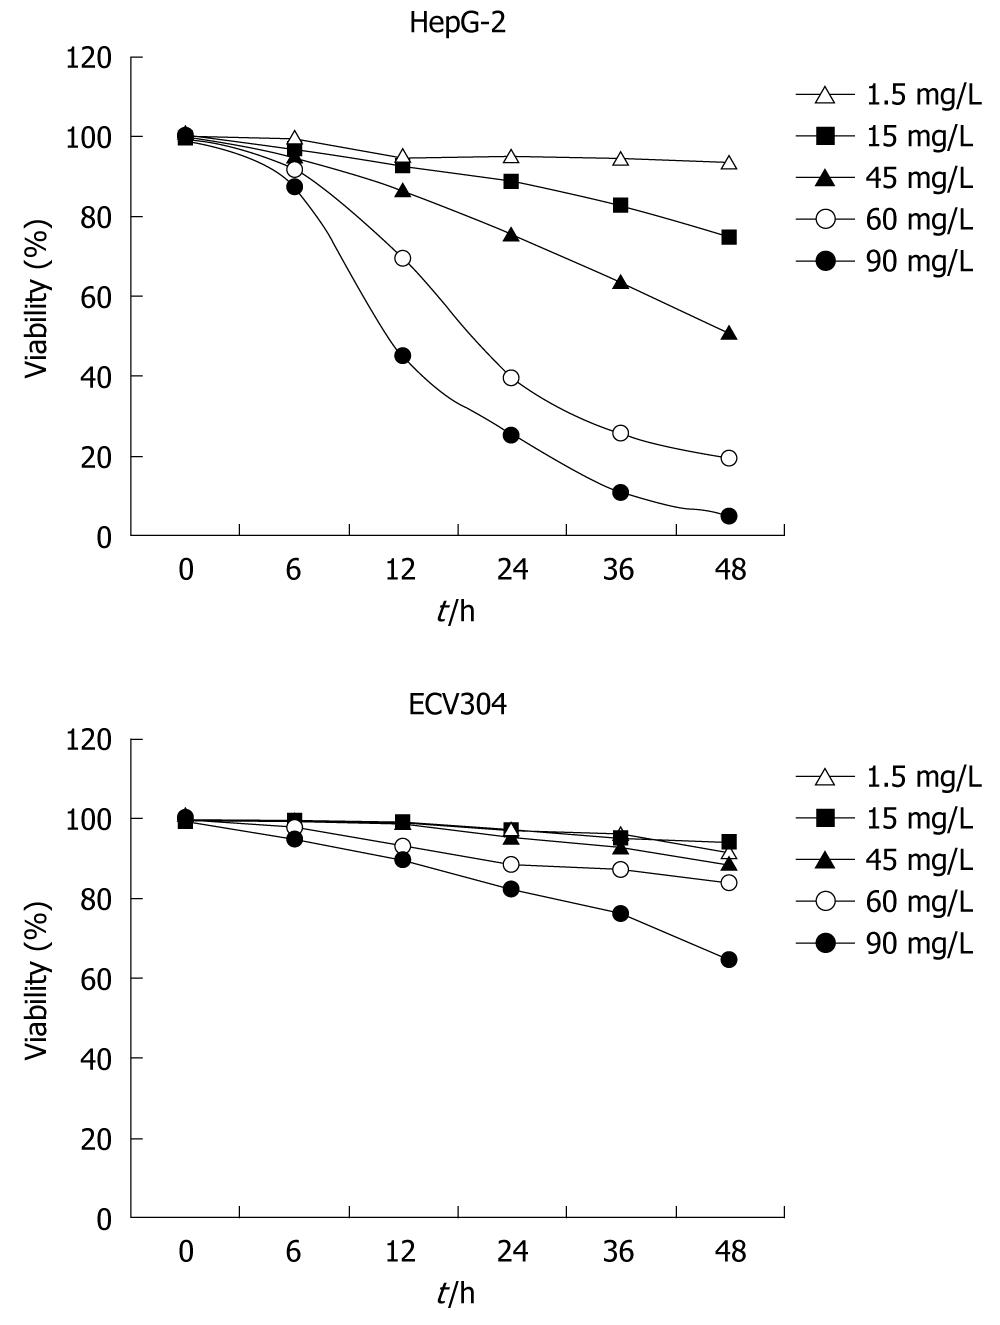
Figure 1 Effects of sargentgloryvine stem extract on HepG-2 viability in vitro (MTT assay).
HepG-2 and ECV304 cells were treated with sargentgloryvine stem extract (SSE) at five concentrations in five different time points. MTT assay showed that cell proliferation inhibition rates were enhanced with increased SSE concentration and treatment time in HepG-2 cells but not in ECV304 cells. Experiments were repeated in triplicate.
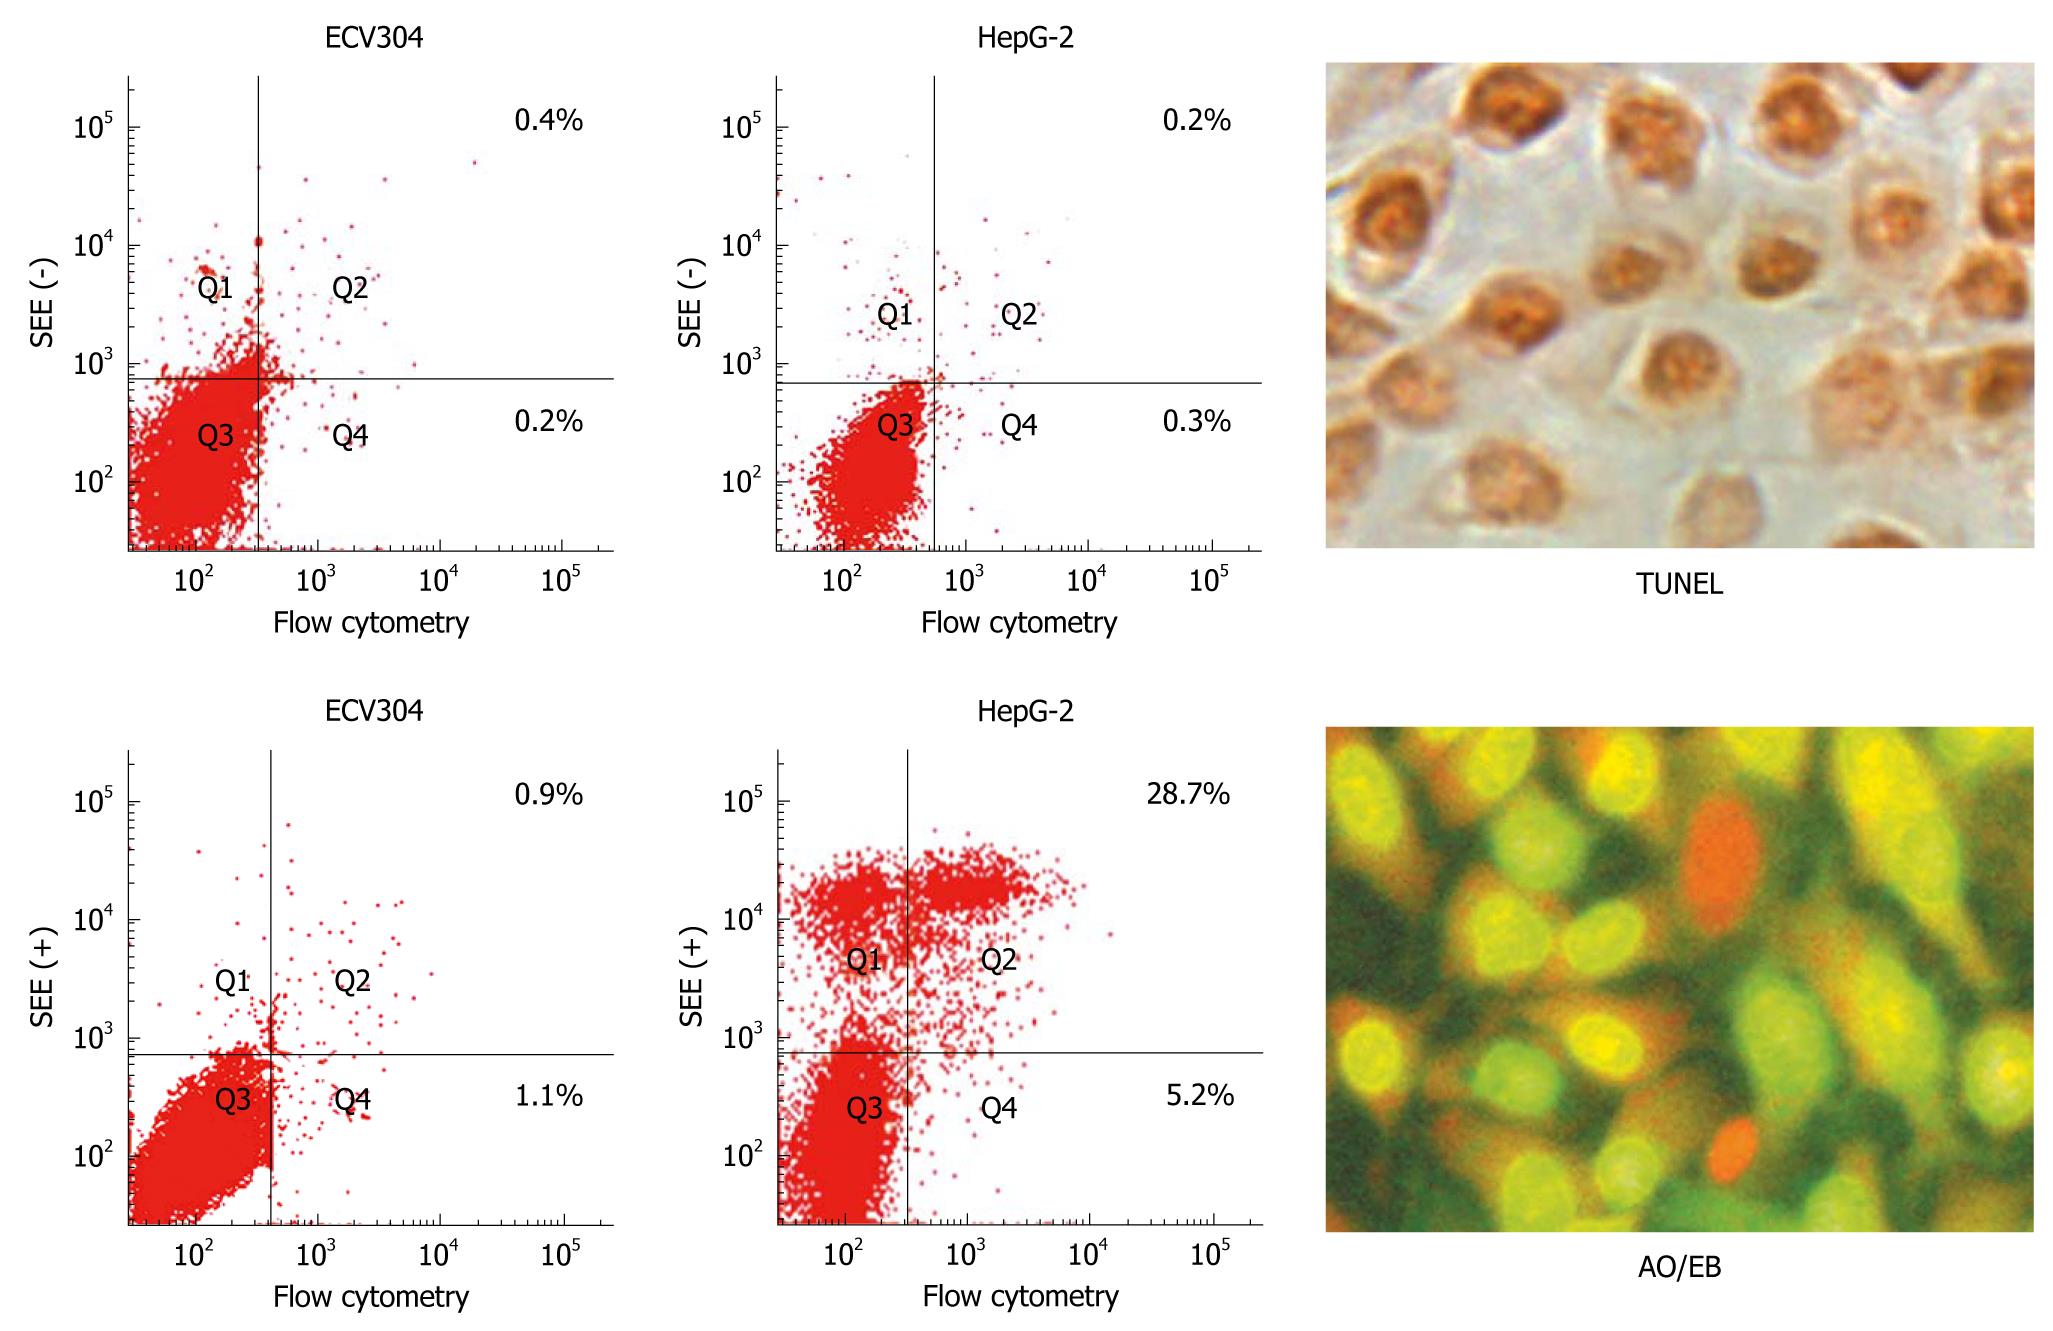
Figure 2 Apoptosis of sargentgloryvine stem extract-treated HepG-2 cells (× 400).
HepG-2 and ECV304 cells were treated with sargentgloryvine stem extract (SSE) at a concentration of 45 mg/mL for 24 h. Flow cytometry showed that apoptosis rate was increased obviously compared with the non-treated control cells, P < 0.05; while ECV304 cells did not show obvious diversity, P > 0.05. Positive signals in nucleus were observed obviously in SSE-treated HepG-2 cells by TdT-Mediated dUTP Nick End Labeling (TUNEL) and acridine orange/ethidium bromide (AO/EB) assays.
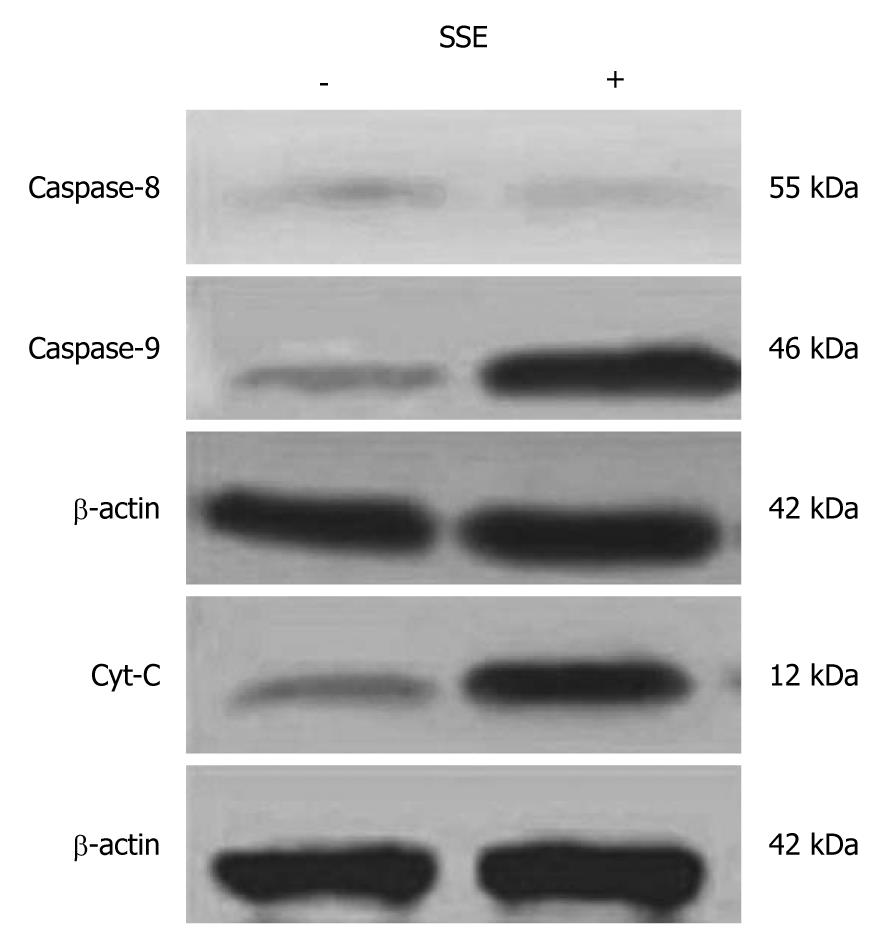
Figure 3 Caspase-8, caspase-9 and cytochrome C in sargentgloryvine stem extract-treated HepG-2 cells.
Significantly up-regulated cleavage was found in caspase 9 but not in caspase 8 in HepG-2 cells treated with 45 mg/L sargentgloryvine stem extract (SSE) for 24 h. Cytochrome C in plasmosin was notably increased. P < 0.05.
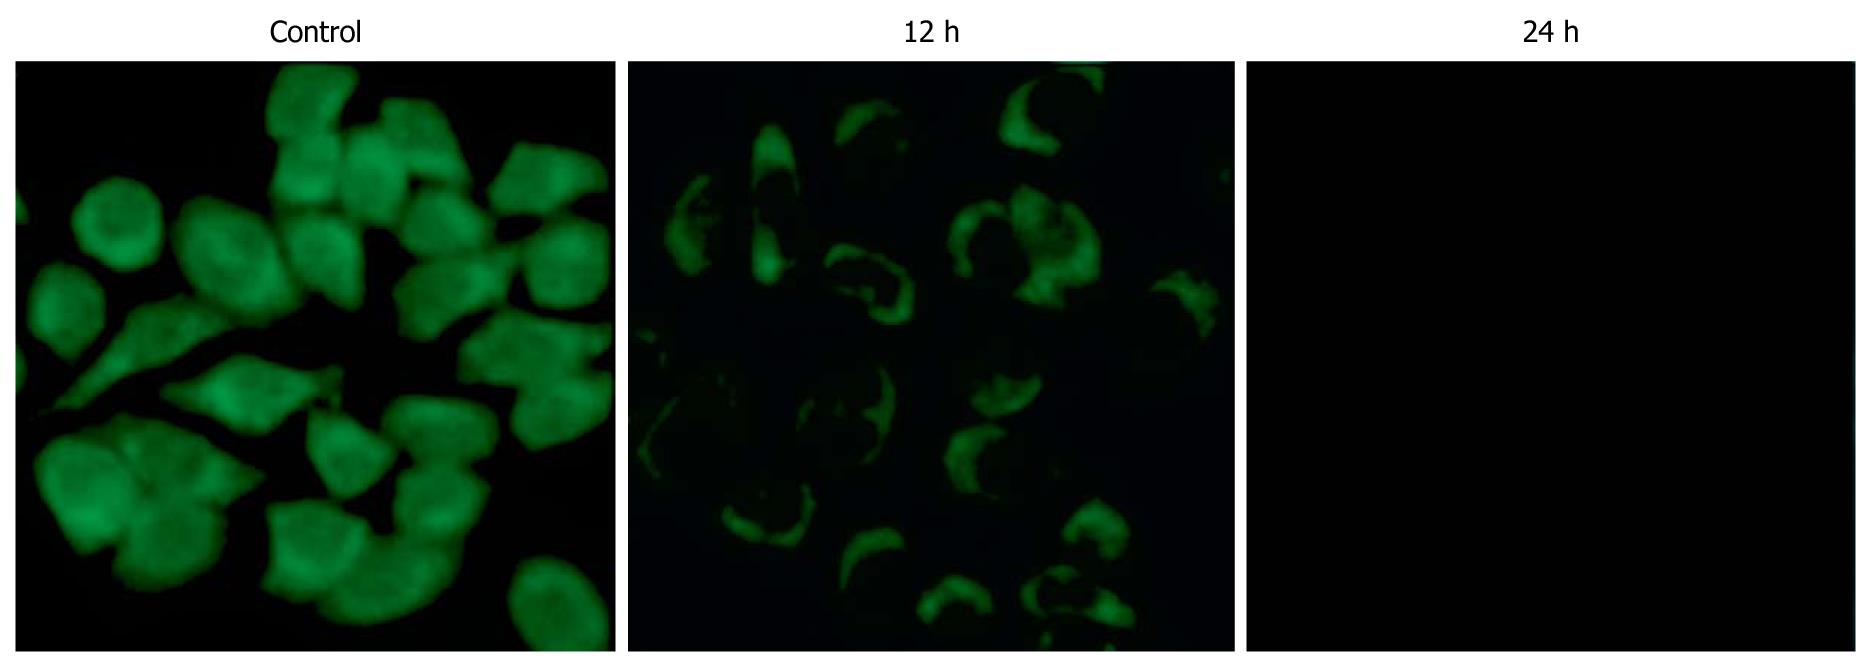
Figure 4 Rh-123 fluorescence in sargentgloryvine stem extract-treated HepG-2 cells (× 400).
Flow cytometry showed that fluorescent intensities in sargentgloryvine stem extract (SSE)-treated (45 mg/L) cells for 12 h maintained their Δψm and only displayed minor changes in Rh-123 fluorescence. In contrast, SSE-treated (45 mg/L) cells for 24 h, fluorescent intensities were significantly weaker than control cells.
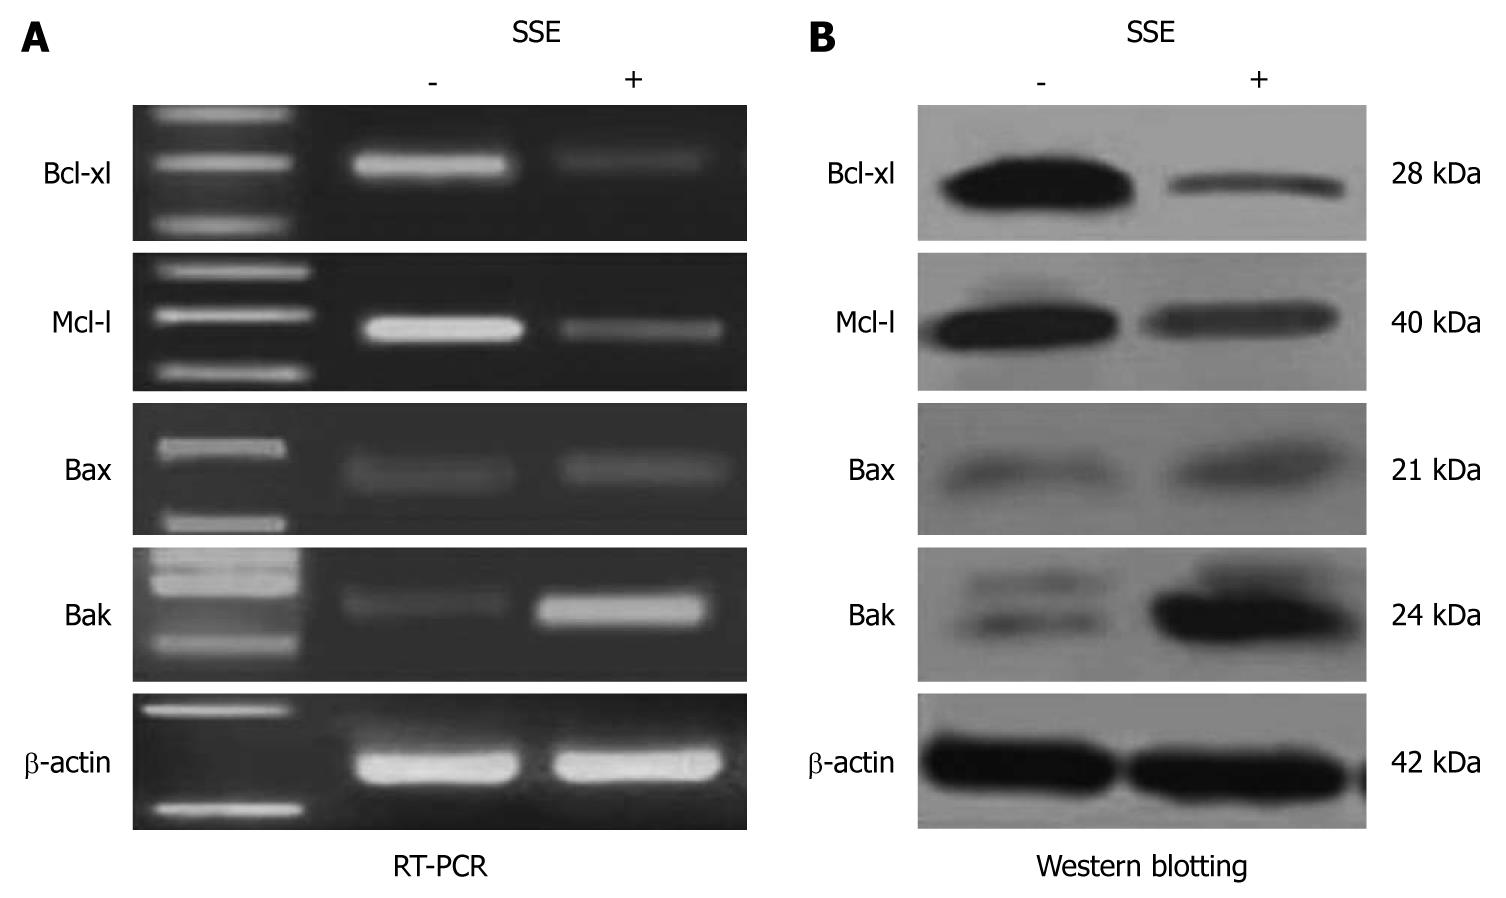
Figure 5 Gene expression in sargentgloryvine stem extract-treated HepG-2 cells.
A: Semi-quantitative reverse transcription polymerase chain reaction (RT-PCR) showed that the expression of Bak but not Bax was significantly increased in HepG-2 cells treated with 45 mg/L sargentgloryvine stem extract (SSE) for 24 h, and the expression of Bcl-xl and Mcl-1 was significantly down-regulated; B: Western-blotting confirmed the SSE induced gene expression changes with up-regulated Bak and down-regulated Bcl-xl and Mcl-1 in HepG-2 cells.
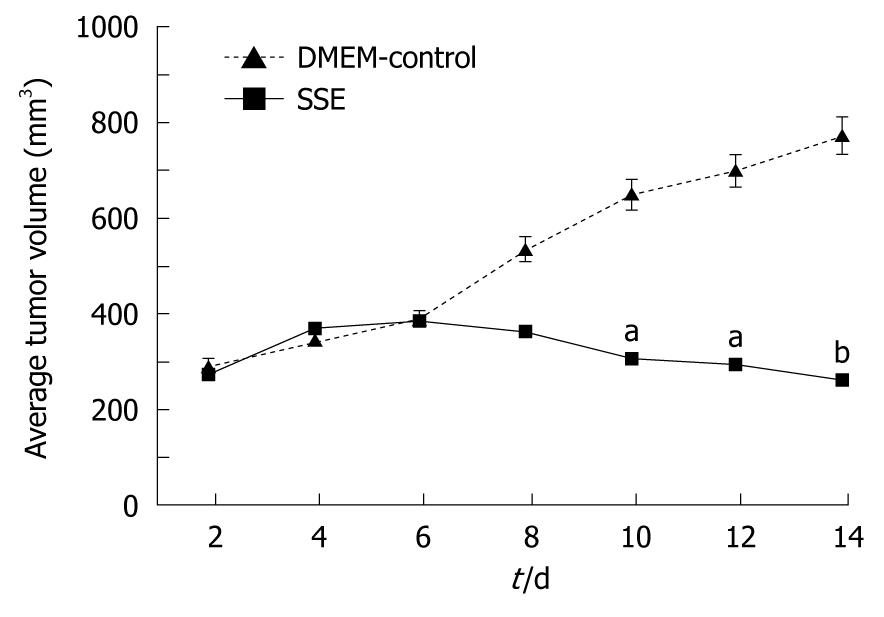
Figure 6 Tumor growth inhibition by systemic sargentgloryvine stem extract-treatment in vivo.
HepG-2 xenograft tumor (approximately 300 mm3) growth in Athymic BALB/c nude mice injected with 50 μL of 18 mg/kg sargentgloryvine stem extract (SSE) or DMEM-control every 2 d for 14 d. The tumor size was measured and the tumor volume was calculated as: width2× length × 0.5. aP < 0.05, bP < 0.01 vs DMEM control.
-
Citation: Wang MH, Long M, Zhu BY, Yang SH, Ren JH, Zhang HZ. Effects of sargentgloryvine stem extracts on HepG-2 cells
in vitro andin vivo . World J Gastroenterol 2011; 17(23): 2848-2854 - URL: https://www.wjgnet.com/1007-9327/full/v17/i23/2848.htm
- DOI: https://dx.doi.org/10.3748/wjg.v17.i23.2848


