Copyright
©2011 Baishideng Publishing Group Co.
World J Gastroenterol. Jun 21, 2011; 17(23): 2848-2854
Published online Jun 21, 2011. doi: 10.3748/wjg.v17.i23.2848
Published online Jun 21, 2011. doi: 10.3748/wjg.v17.i23.2848
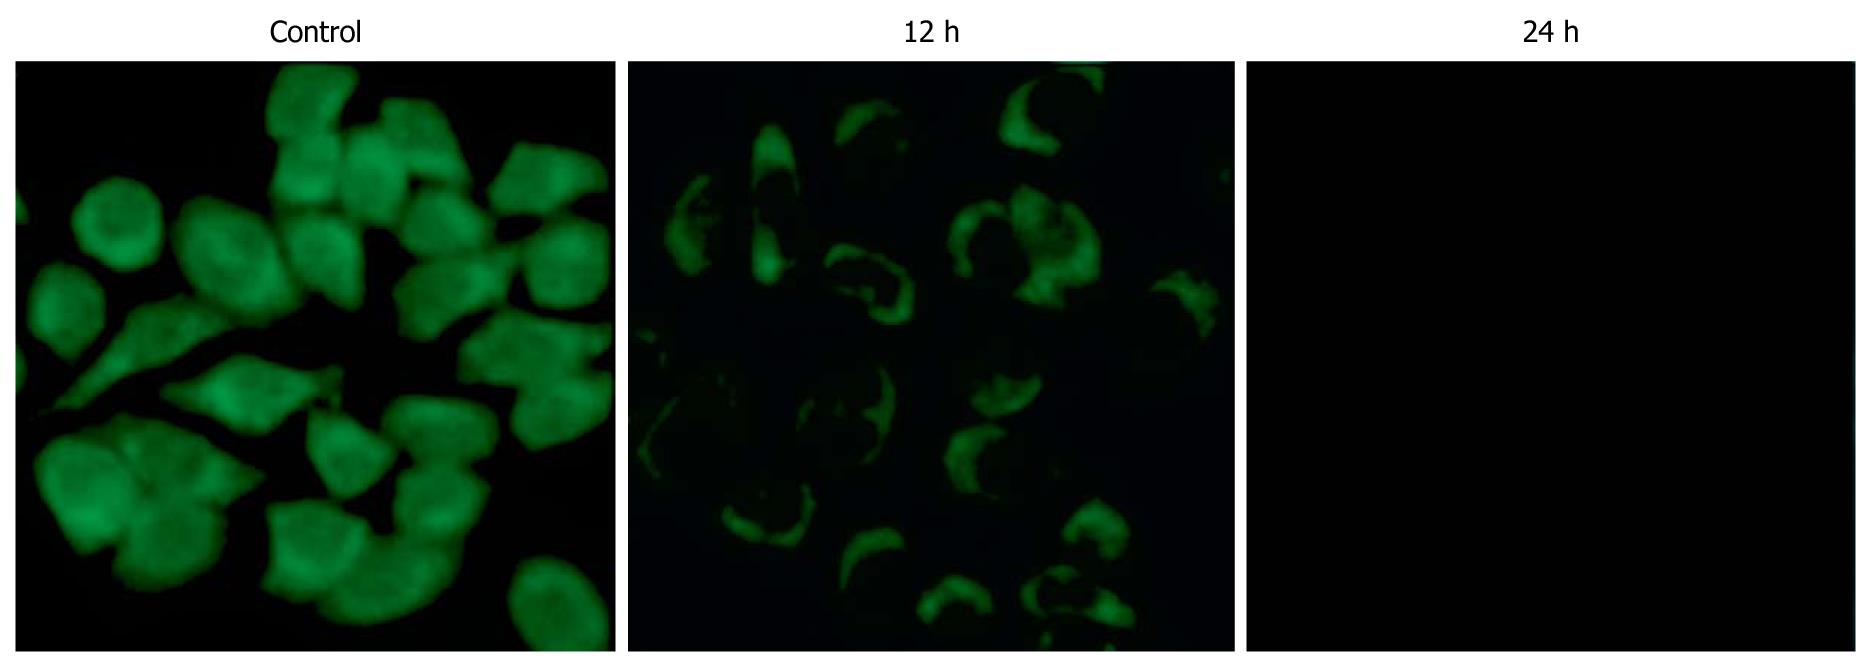
Figure 4 Rh-123 fluorescence in sargentgloryvine stem extract-treated HepG-2 cells (× 400).
Flow cytometry showed that fluorescent intensities in sargentgloryvine stem extract (SSE)-treated (45 mg/L) cells for 12 h maintained their Δψm and only displayed minor changes in Rh-123 fluorescence. In contrast, SSE-treated (45 mg/L) cells for 24 h, fluorescent intensities were significantly weaker than control cells.
-
Citation: Wang MH, Long M, Zhu BY, Yang SH, Ren JH, Zhang HZ. Effects of sargentgloryvine stem extracts on HepG-2 cells
in vitro andin vivo . World J Gastroenterol 2011; 17(23): 2848-2854 - URL: https://www.wjgnet.com/1007-9327/full/v17/i23/2848.htm
- DOI: https://dx.doi.org/10.3748/wjg.v17.i23.2848


