Copyright
©2010 Baishideng.
World J Gastroenterol. Jan 7, 2010; 16(1): 30-41
Published online Jan 7, 2010. doi: 10.3748/wjg.v16.i1.30
Published online Jan 7, 2010. doi: 10.3748/wjg.v16.i1.30
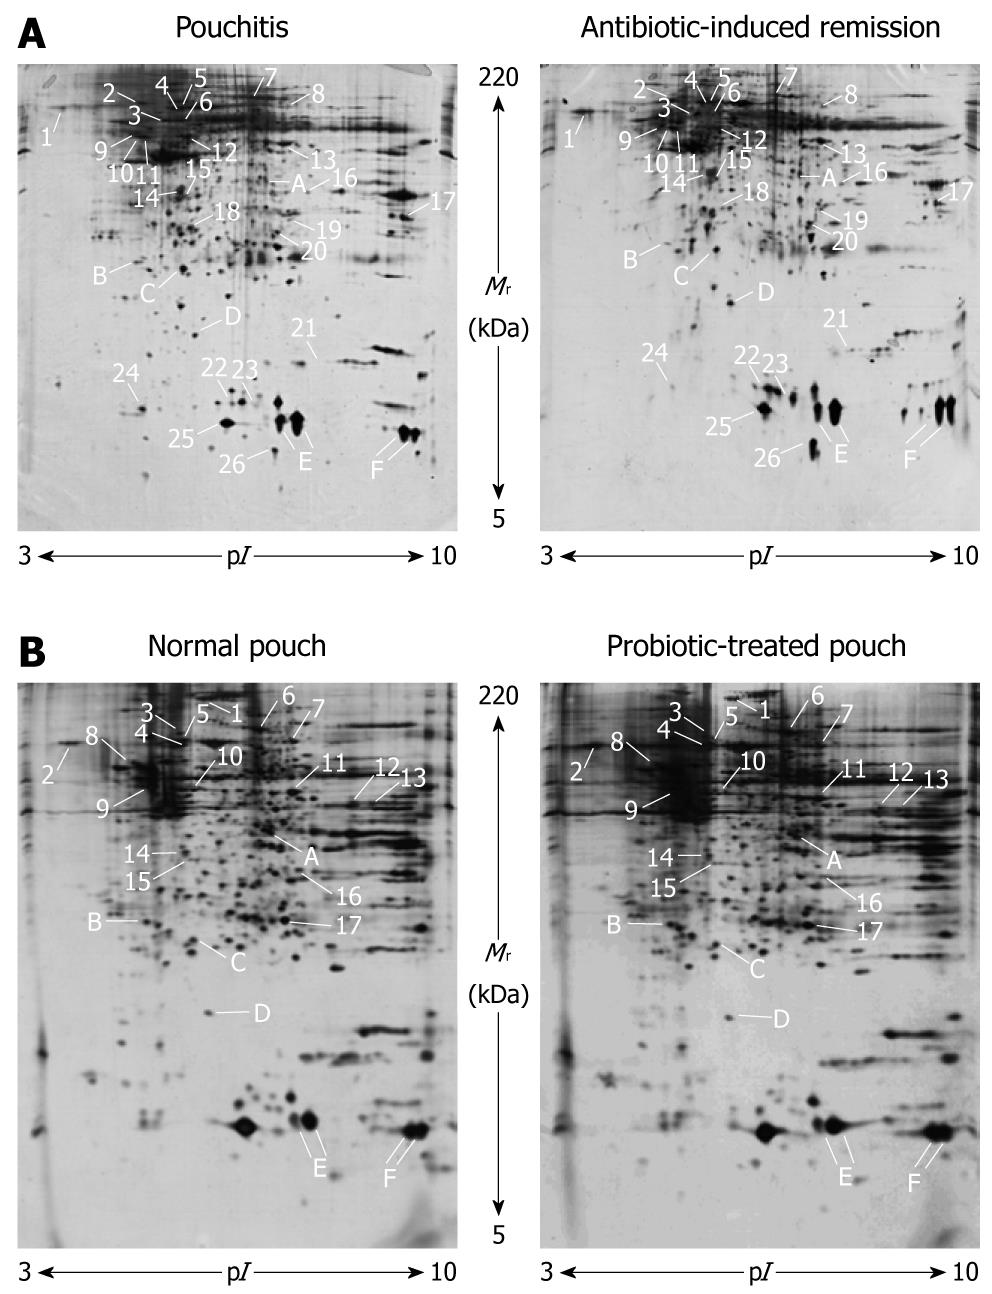
Figure 1 Representative 2D gel maps of the mucosal biopsy proteomes from a patient with chronic refractory pouchitis before (left) and after (right) antibiotic therapy (A) and from a subject with a non-inflamed pouch before (left) and after (right) probiotic administration (B).
Proteins showing altered expression identified by gel matching and MALDI-TOF MS analysis are numbered and reported in Table 1. Identified spots with conserved expression levels in all patients and conditions are marked by letters and shown in Table 2.
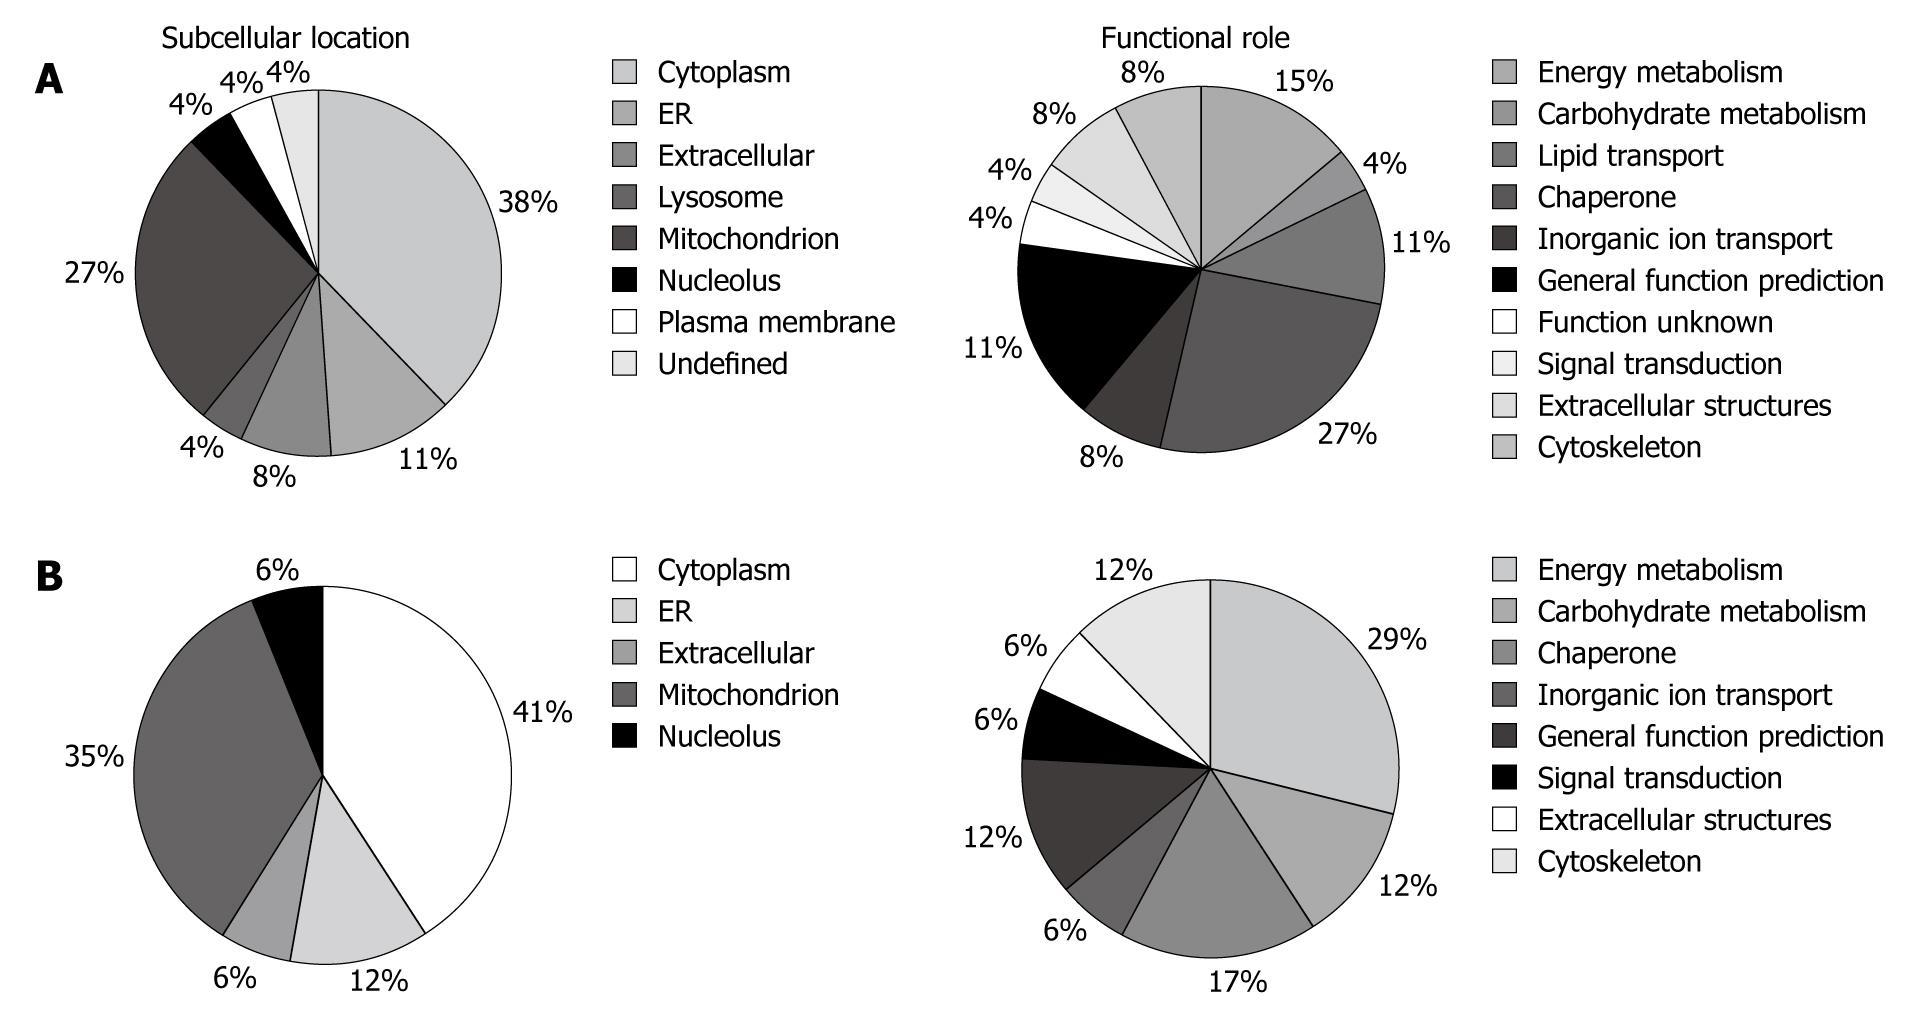
Figure 2 Pie charts representing the distribution of the differentially expressed proteins from pouchitis/pouch remission (A) and normal pouch/probiotic-treated pouch (B) group comparison, according to their subcellular location and biological function.
ER: Endoplasmic reticulum.
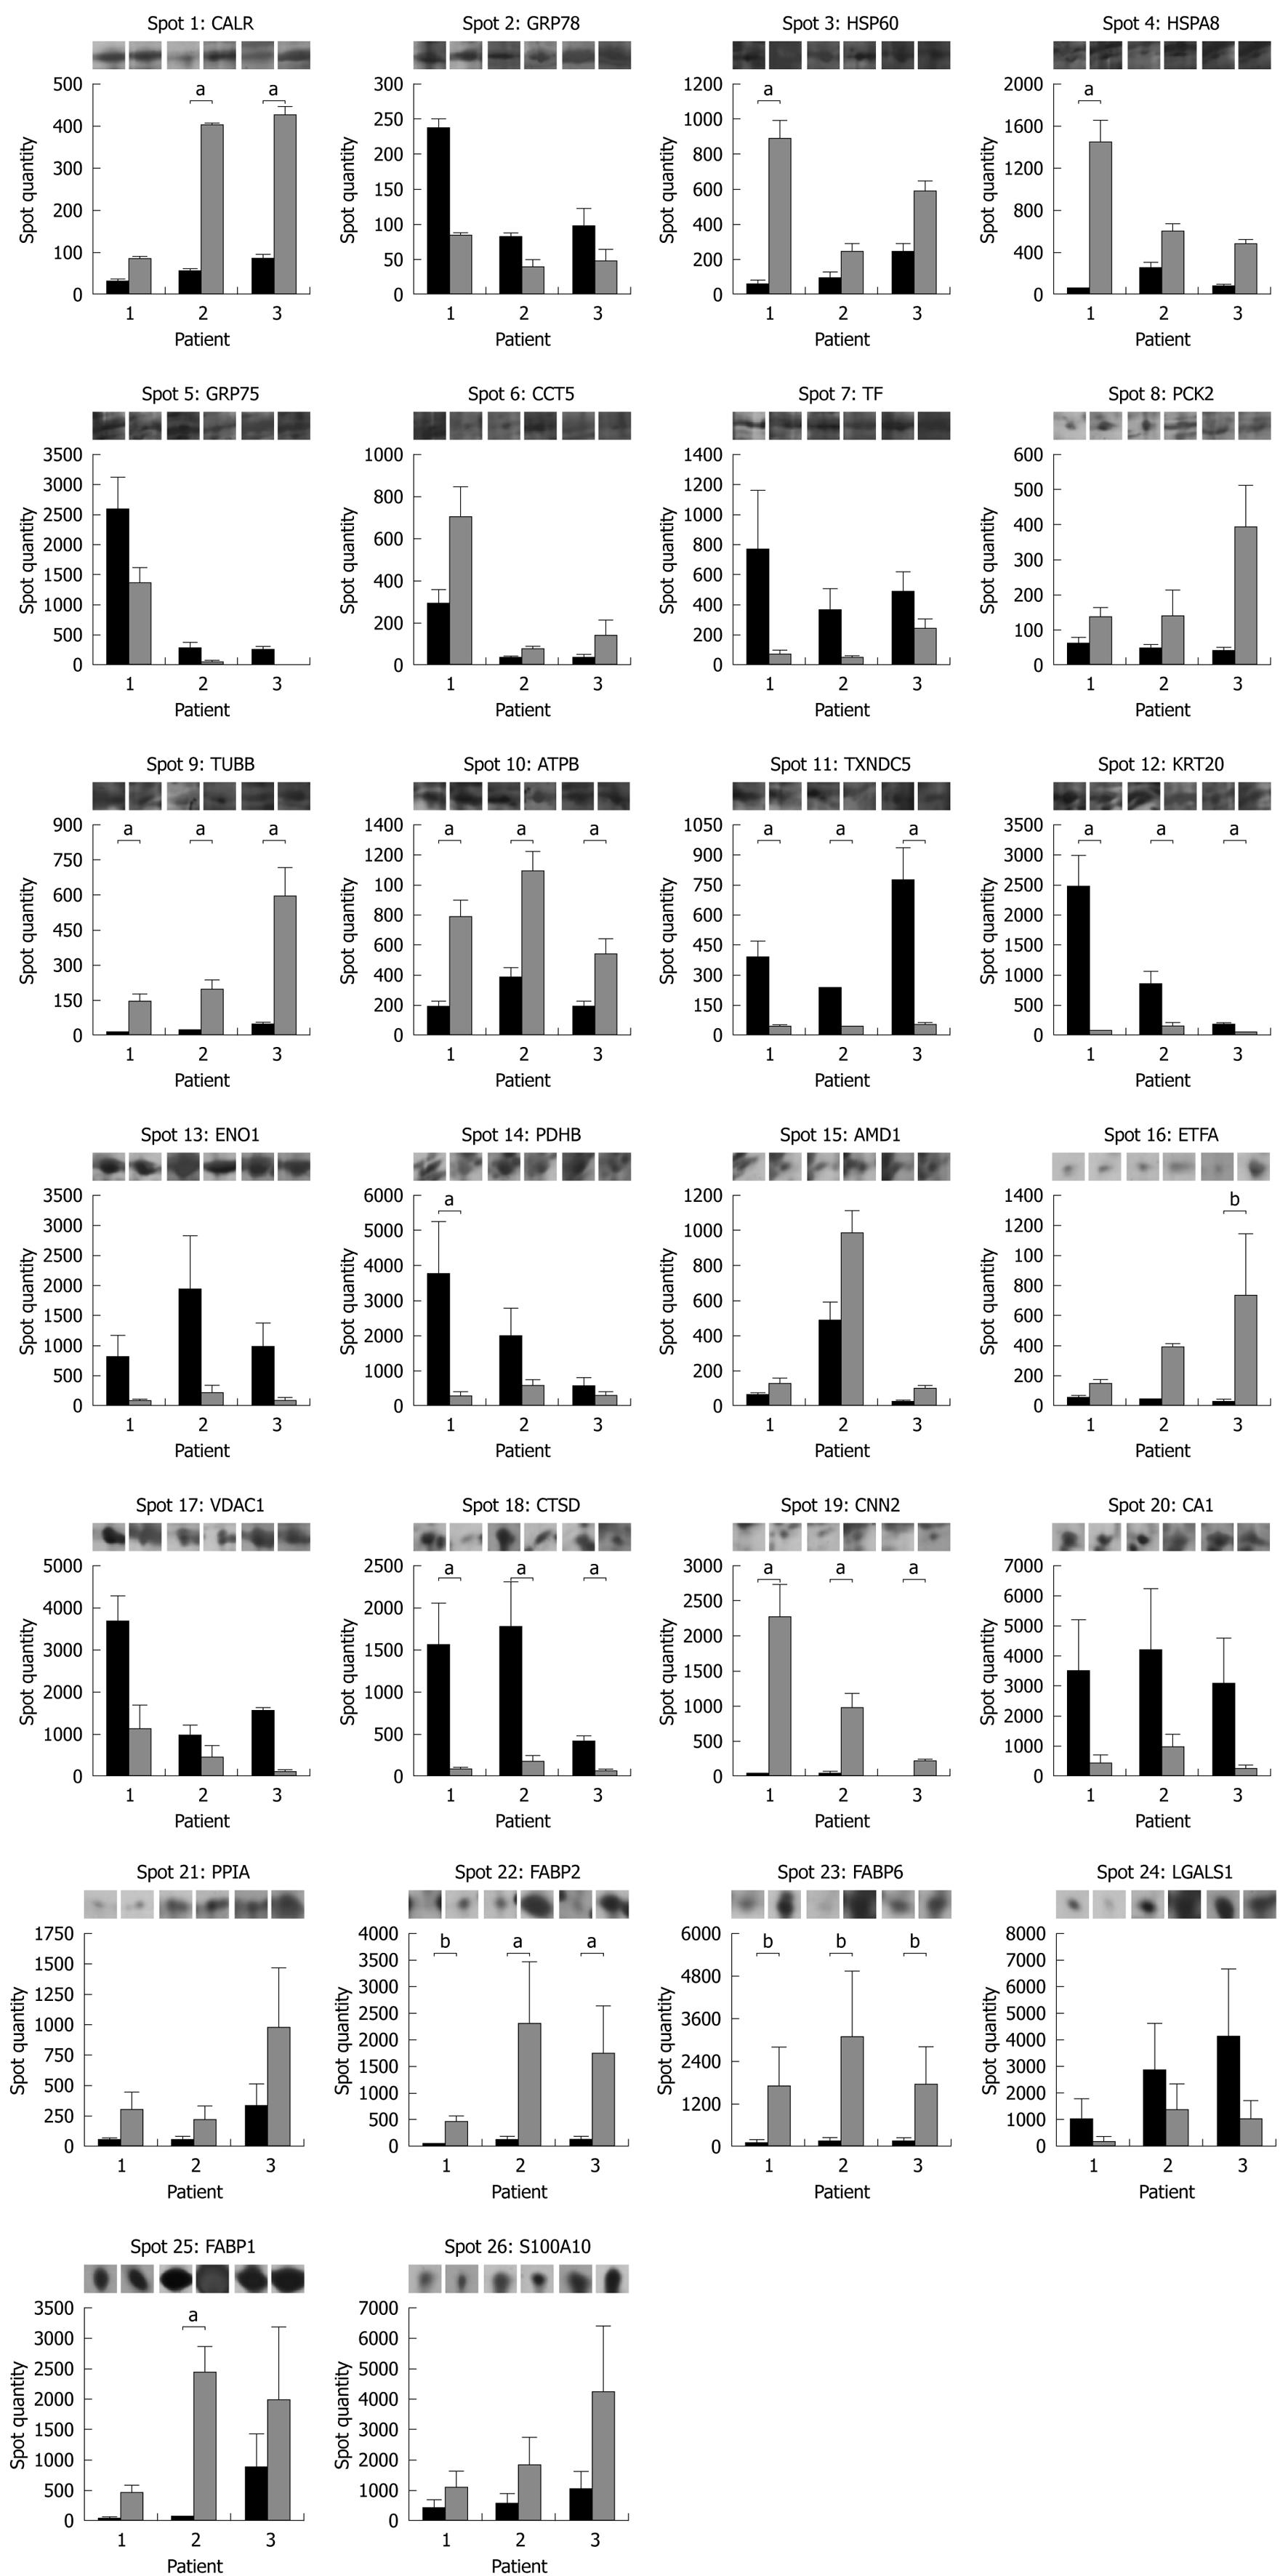
Figure 3 Protein expression histograms of the 26 differentially expressed protein spots between pouchitis (dark grey) and antibiotic-induced remission (light grey).
Each bar represents the average spot quantity determined from 3 technical replicates for each patient condition by PDQuest. Representative gel images are displayed on top of each graph. aP < 0.05, bP = 0.06 for ETFA and P = 0.07 for FABP2 and FABP6.
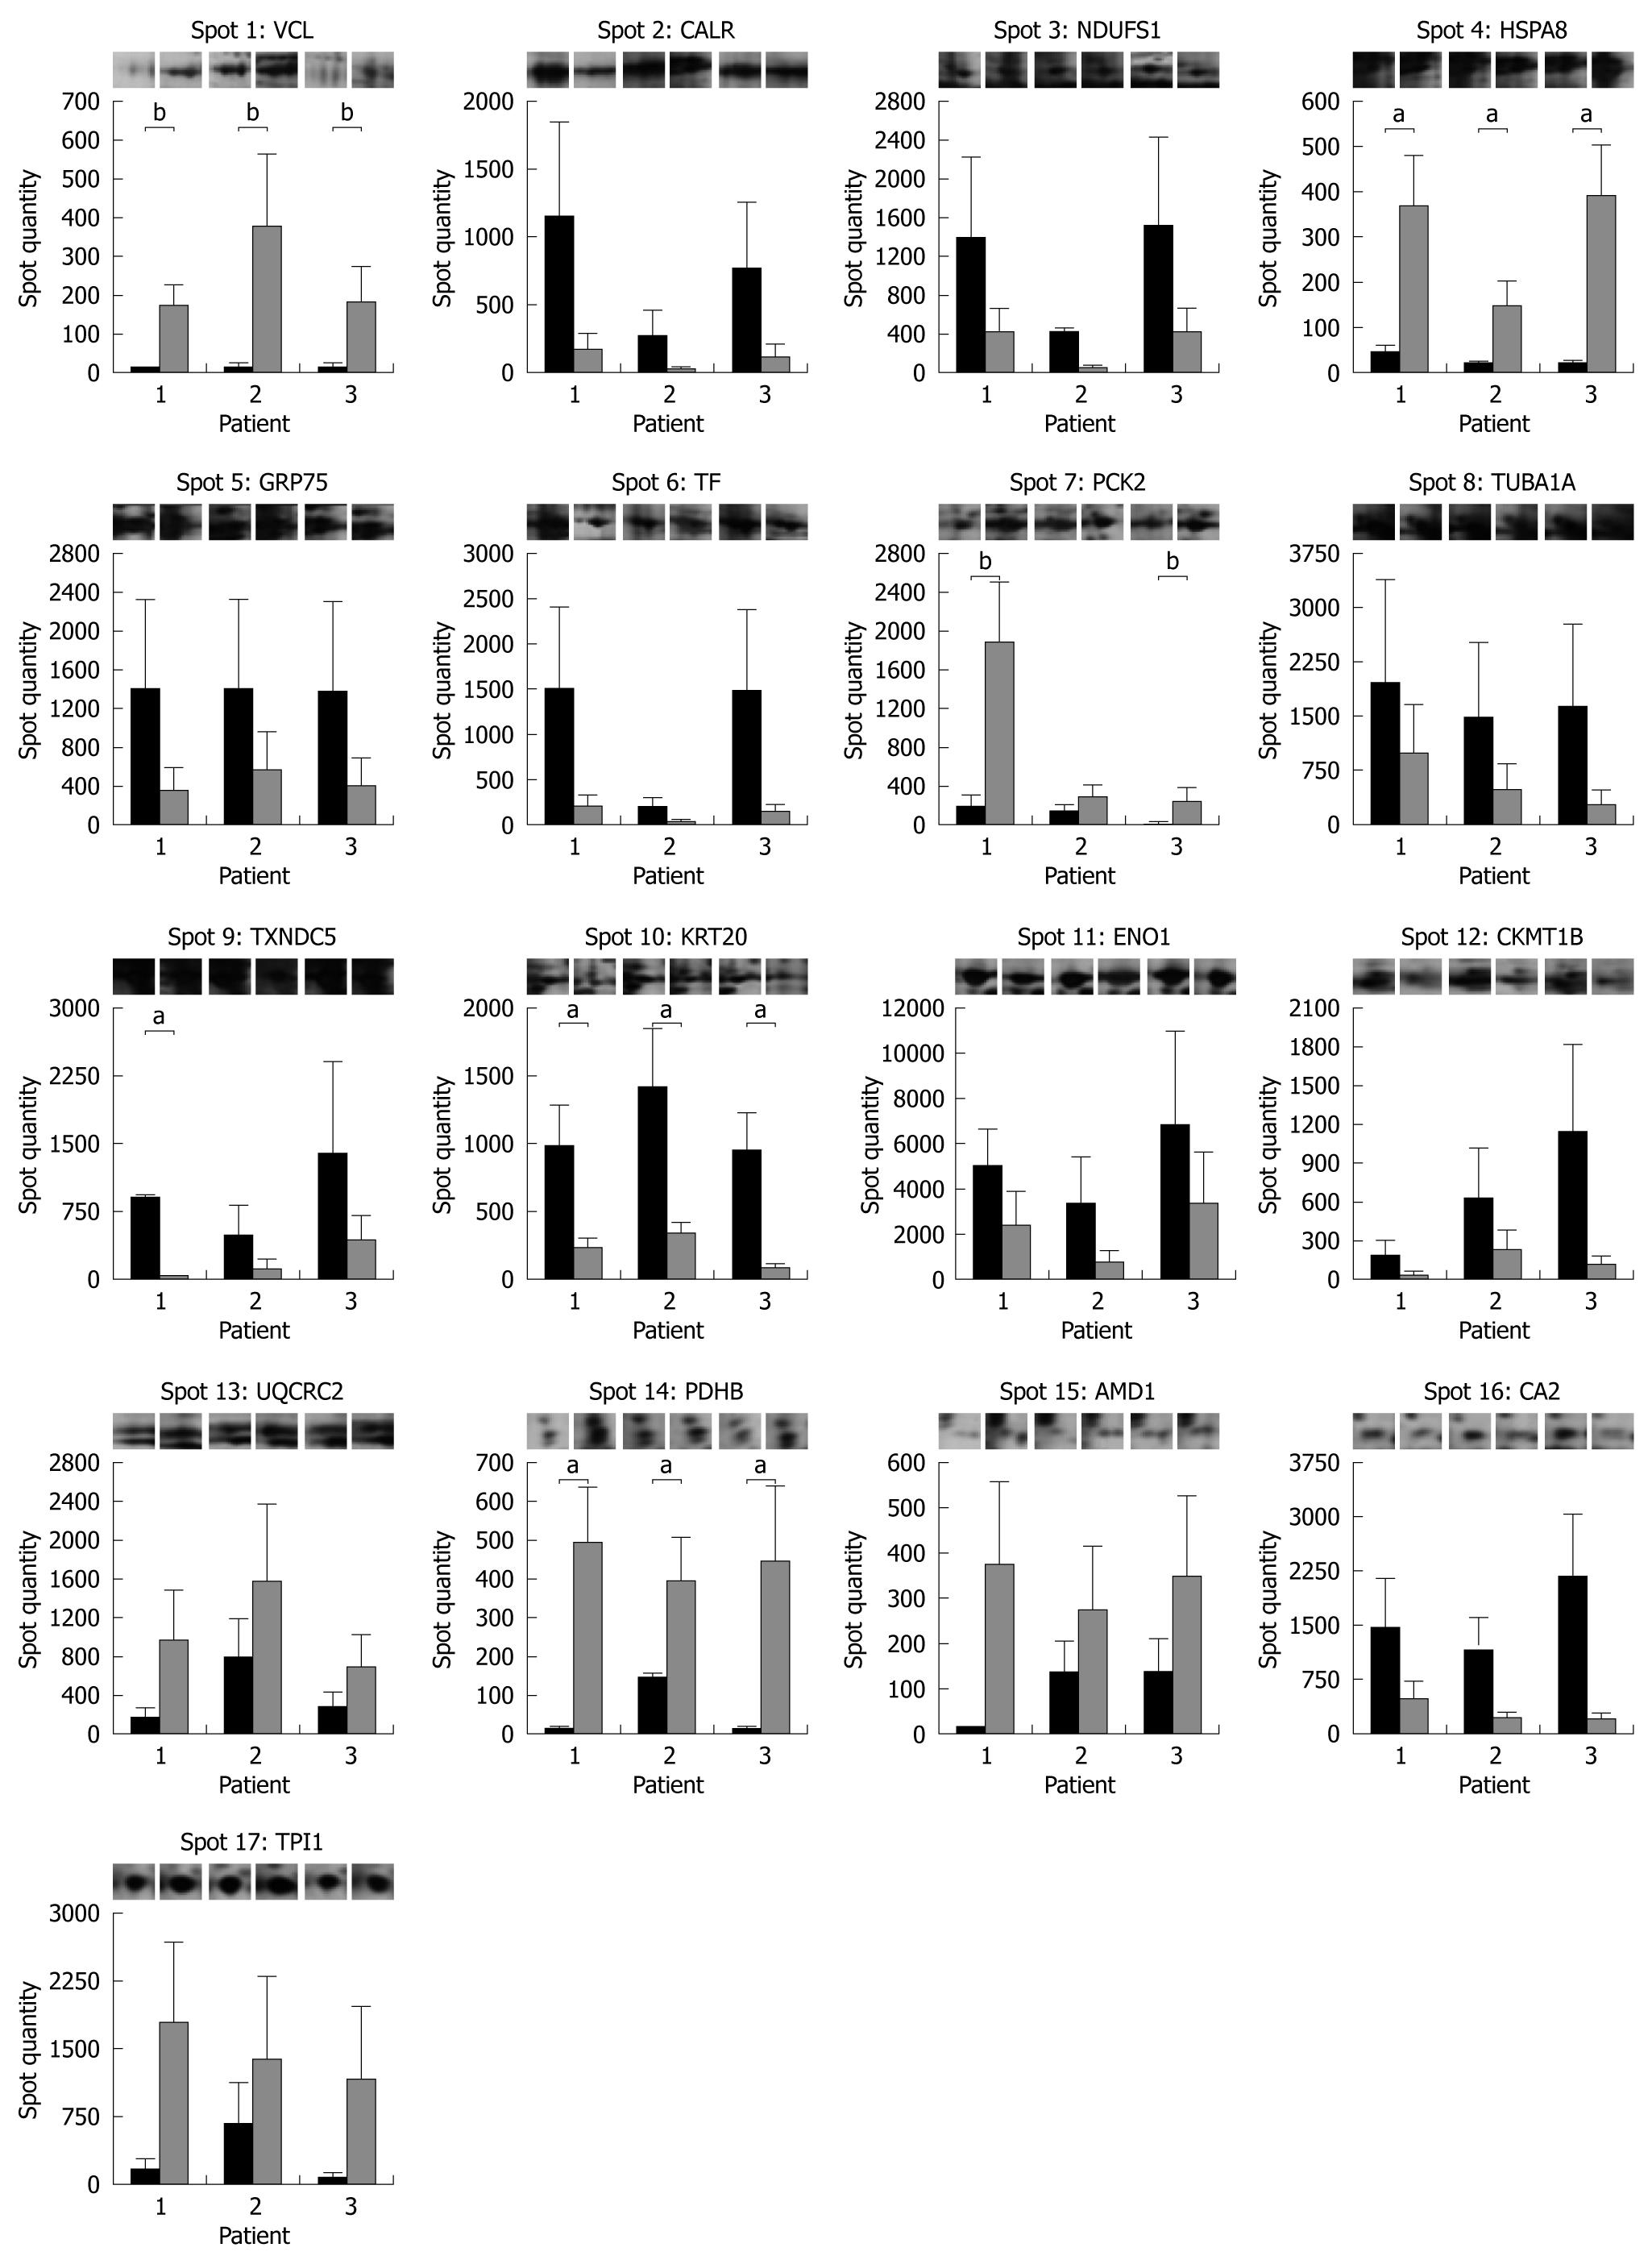
Figure 4 Protein expression histograms of the 17 differentially expressed protein spots in non-inflamed pouch before (dark grey) and after (light grey) probiotic treatment.
Each bar represents the average spot quantity determined from 3 technical replicates for each subject condition by PDQuest. Representative gel images are displayed on top of each graph. aP < 0.05, bP = 0.06 for VCL and PCK2.
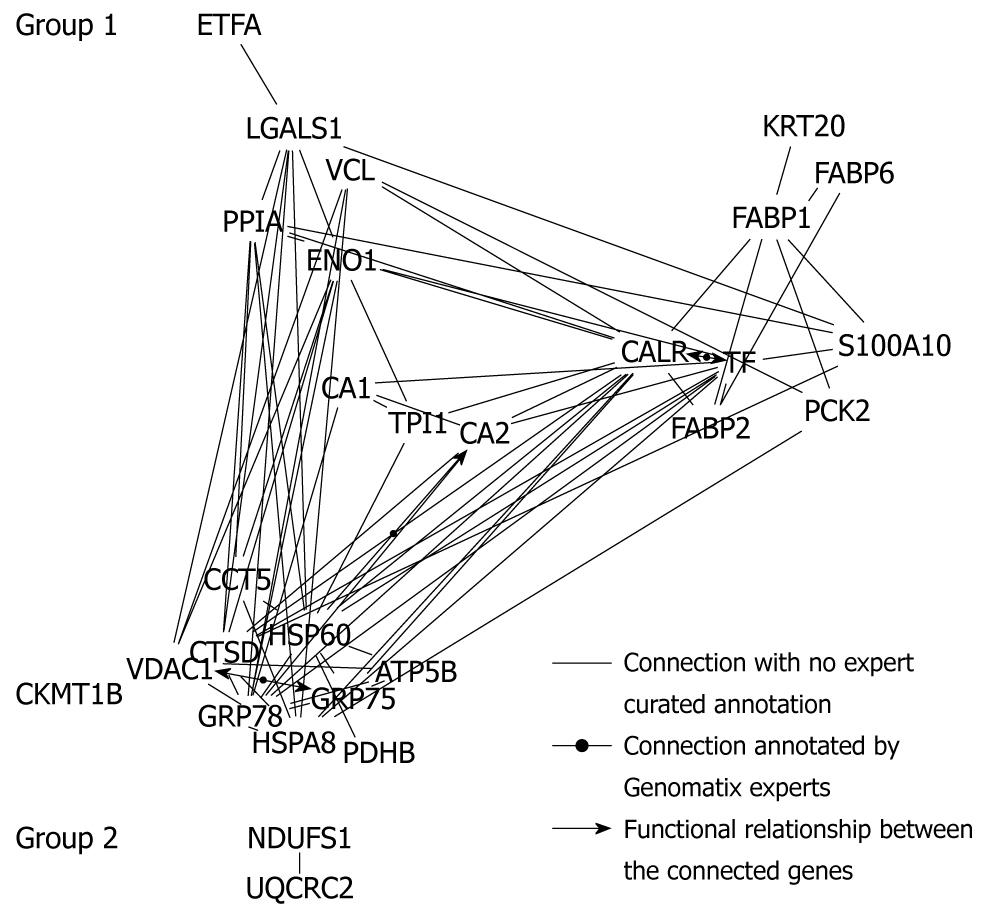
Figure 5 Bibliometric data analysis.
Protein-protein network tree generation using the data-mining program Bibliosphere software.
- Citation: Turroni S, Vitali B, Candela M, Gionchetti P, Rizzello F, Campieri M, Brigidi P. Antibiotics and probiotics in chronic pouchitis: A comparative proteomic approach. World J Gastroenterol 2010; 16(1): 30-41
- URL: https://www.wjgnet.com/1007-9327/full/v16/i1/30.htm
- DOI: https://dx.doi.org/10.3748/wjg.v16.i1.30


