Copyright
©2010 Baishideng.
World J Gastroenterol. Jan 7, 2010; 16(1): 30-41
Published online Jan 7, 2010. doi: 10.3748/wjg.v16.i1.30
Published online Jan 7, 2010. doi: 10.3748/wjg.v16.i1.30
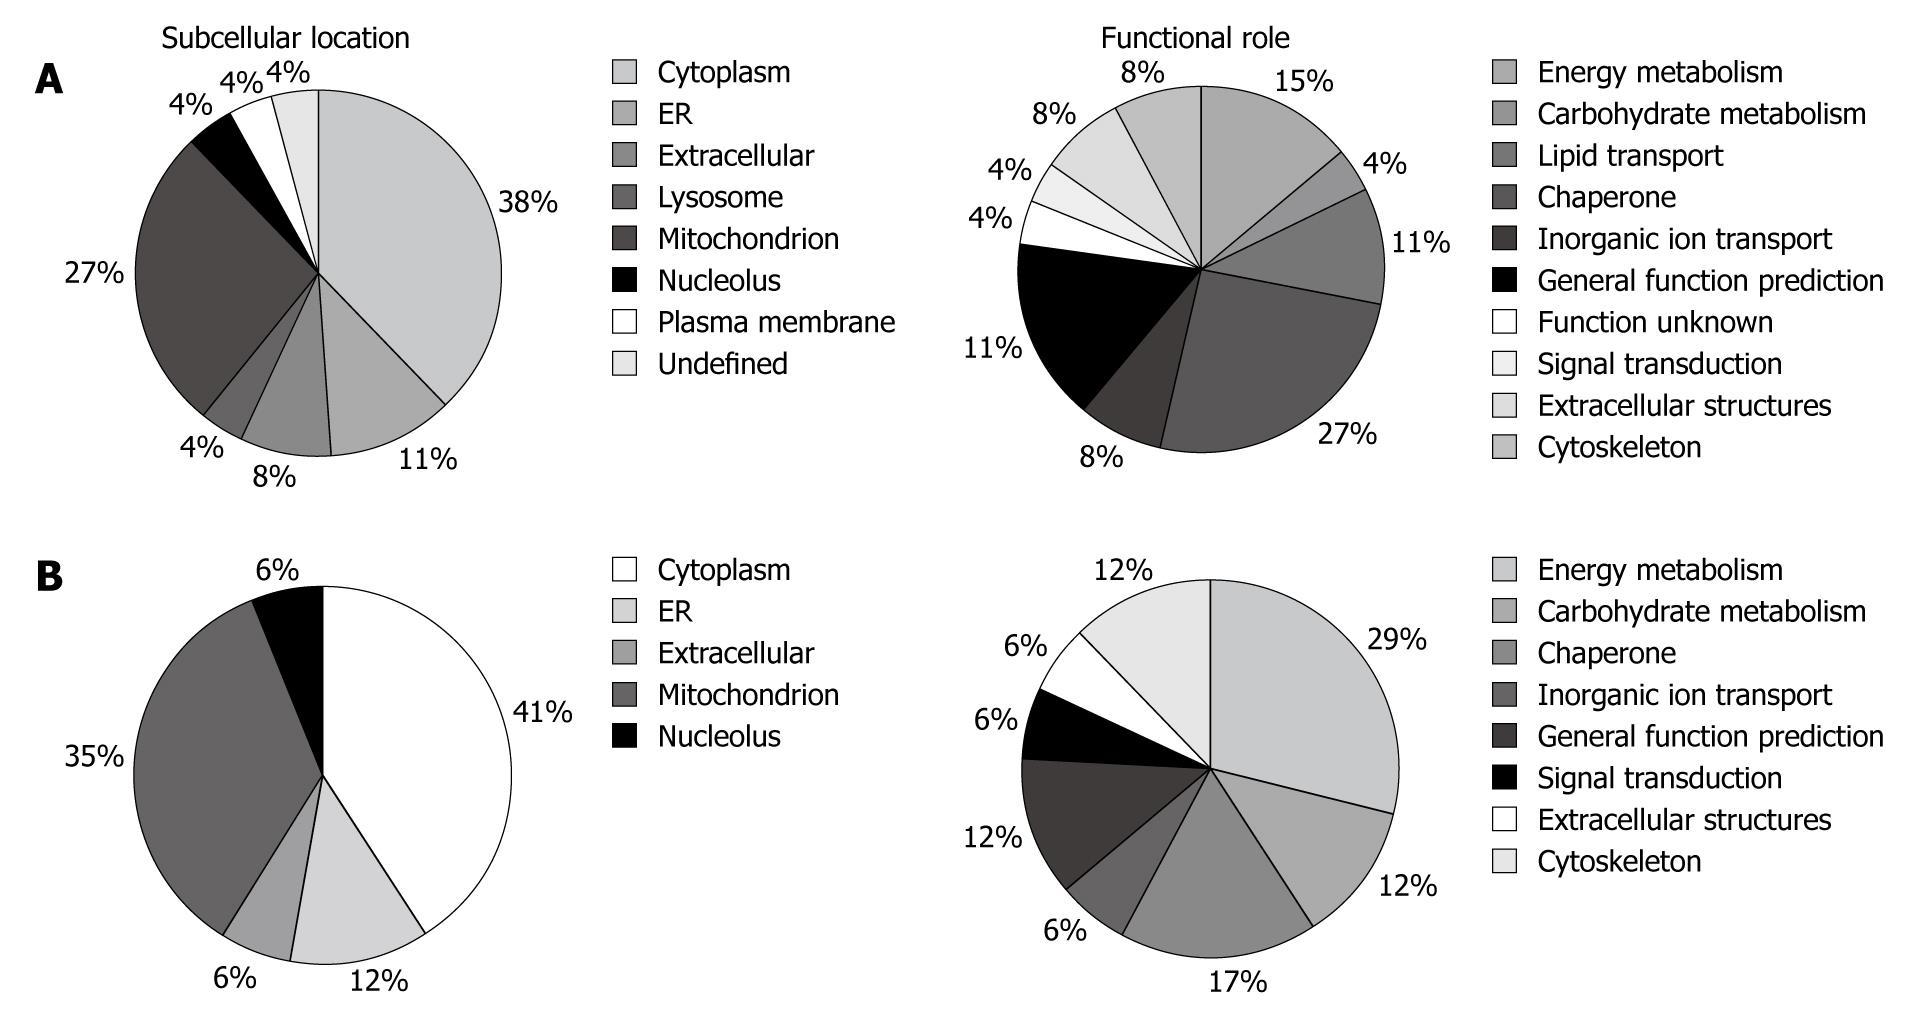
Figure 2 Pie charts representing the distribution of the differentially expressed proteins from pouchitis/pouch remission (A) and normal pouch/probiotic-treated pouch (B) group comparison, according to their subcellular location and biological function.
ER: Endoplasmic reticulum.
- Citation: Turroni S, Vitali B, Candela M, Gionchetti P, Rizzello F, Campieri M, Brigidi P. Antibiotics and probiotics in chronic pouchitis: A comparative proteomic approach. World J Gastroenterol 2010; 16(1): 30-41
- URL: https://www.wjgnet.com/1007-9327/full/v16/i1/30.htm
- DOI: https://dx.doi.org/10.3748/wjg.v16.i1.30


