Copyright
©2010 Baishideng.
World J Gastroenterol. Jan 7, 2010; 16(1): 30-41
Published online Jan 7, 2010. doi: 10.3748/wjg.v16.i1.30
Published online Jan 7, 2010. doi: 10.3748/wjg.v16.i1.30
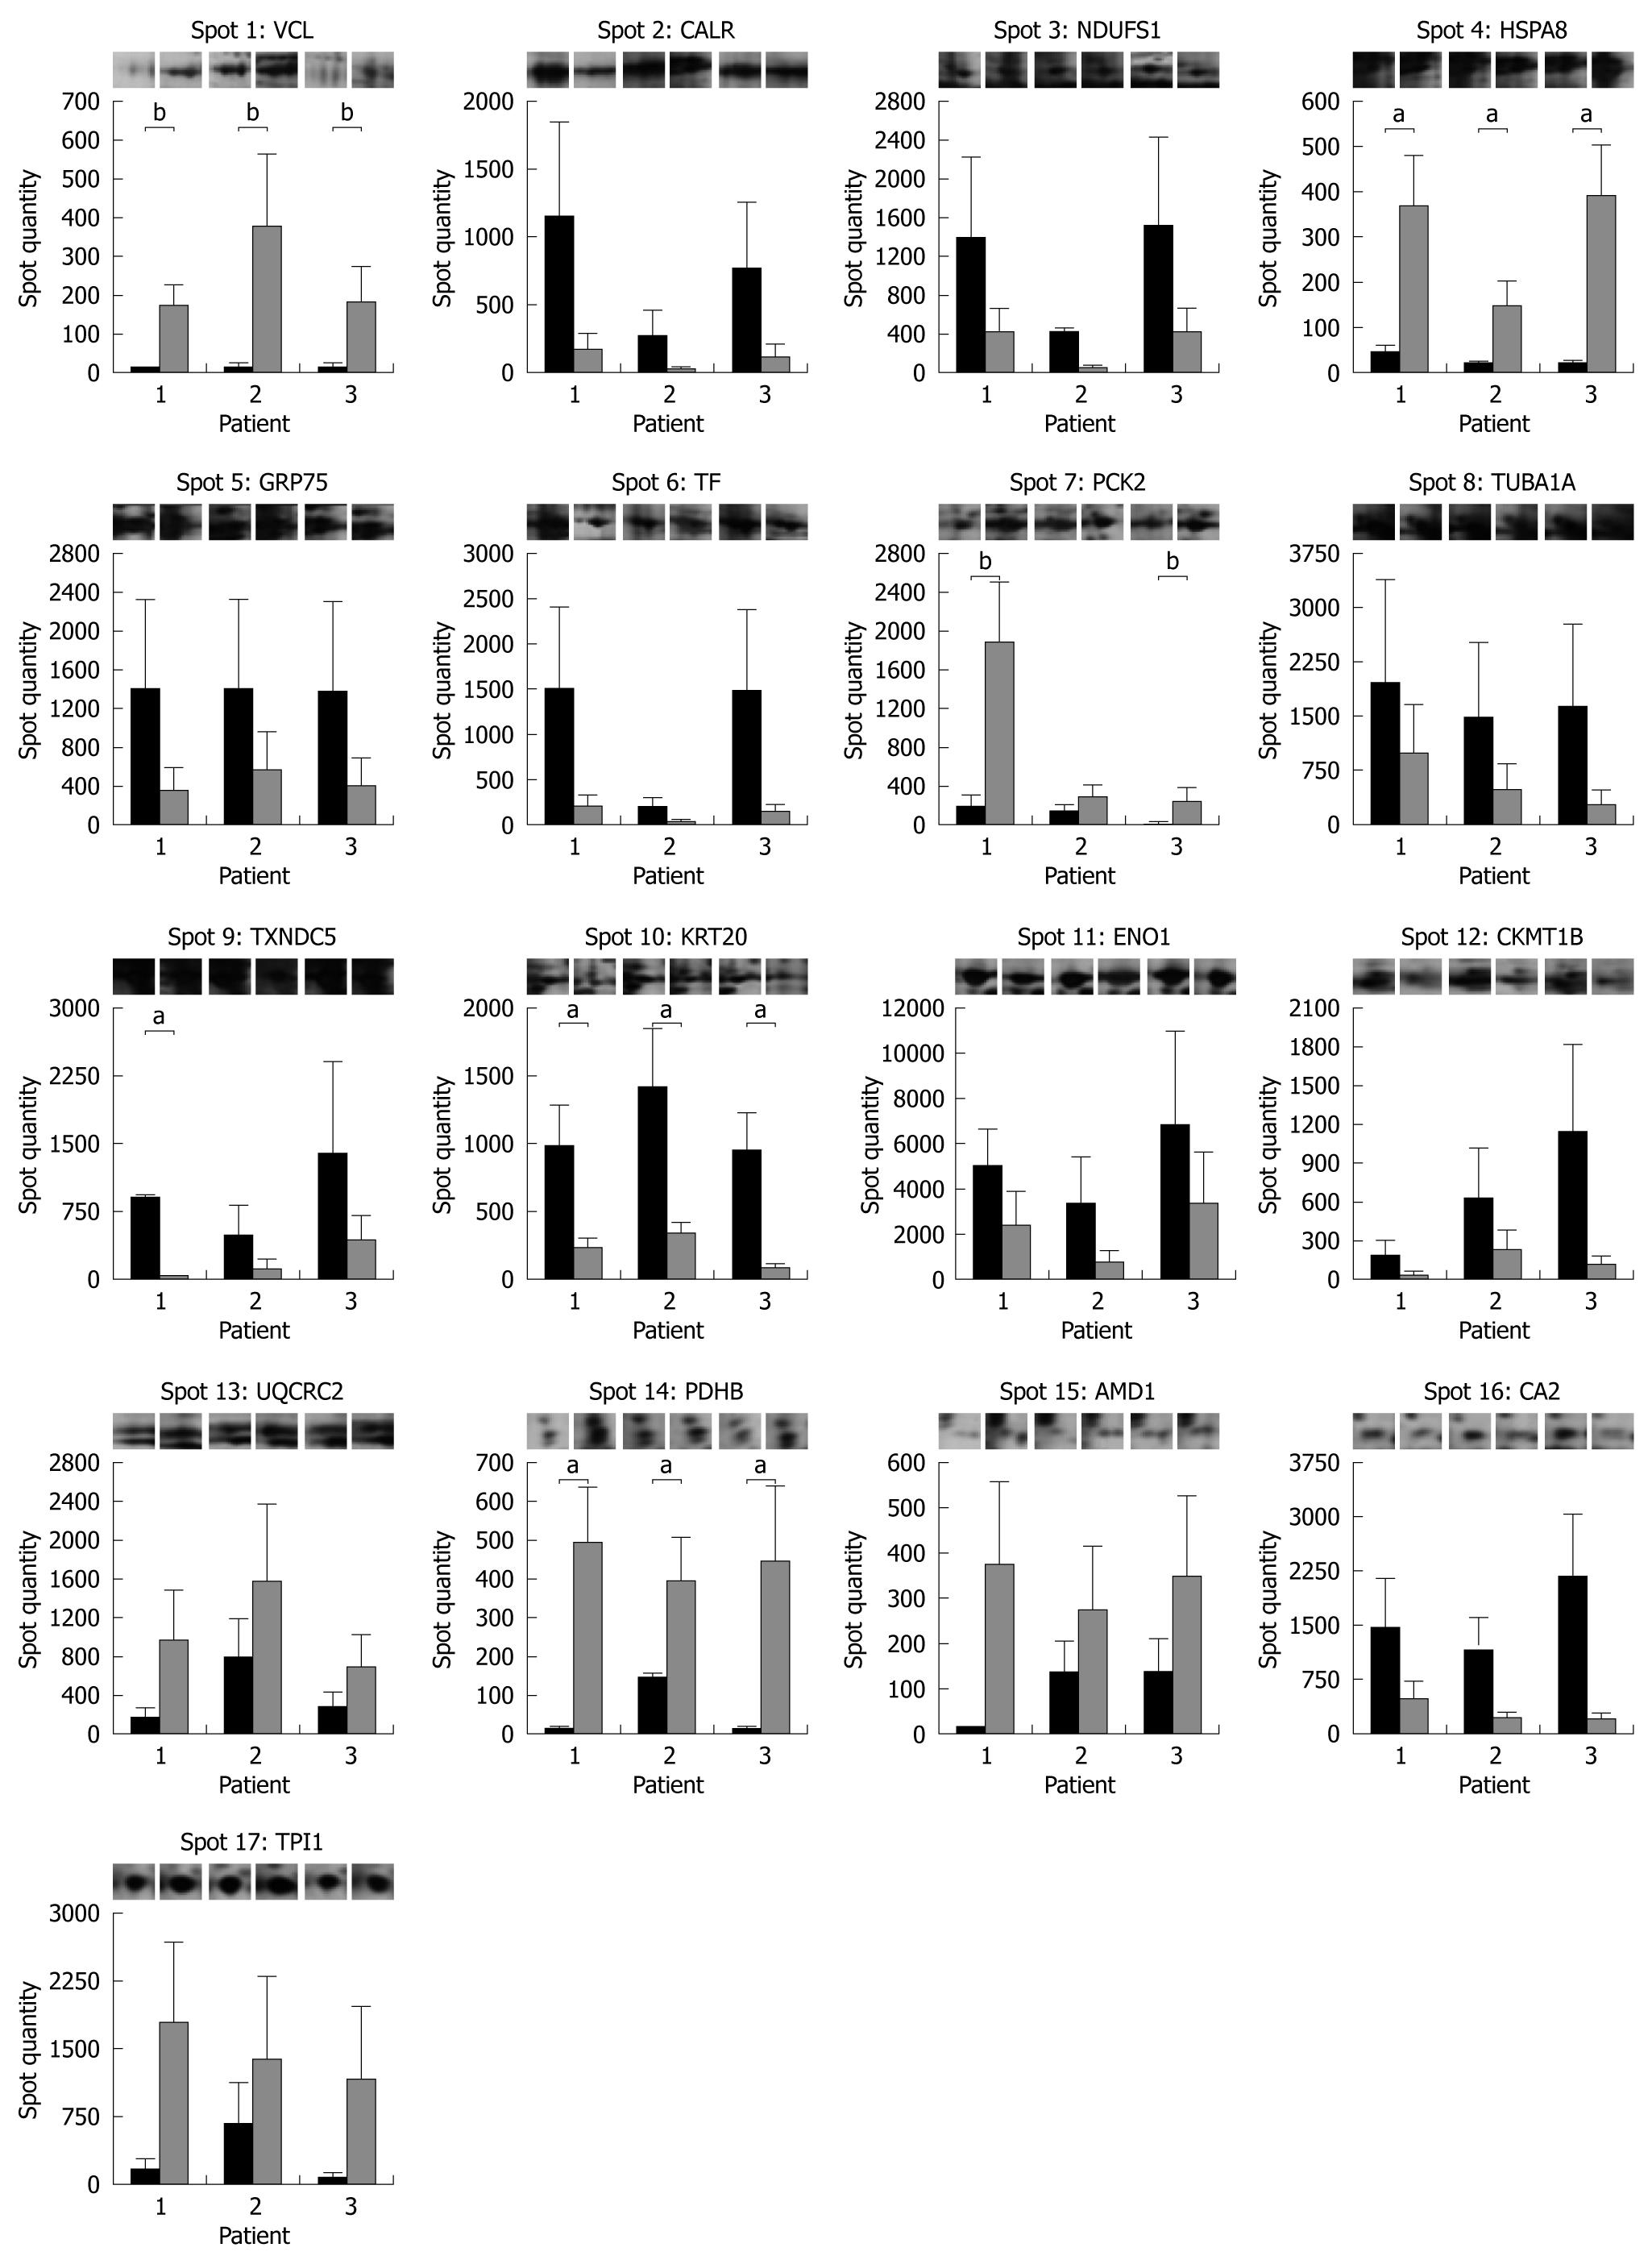
Figure 4 Protein expression histograms of the 17 differentially expressed protein spots in non-inflamed pouch before (dark grey) and after (light grey) probiotic treatment.
Each bar represents the average spot quantity determined from 3 technical replicates for each subject condition by PDQuest. Representative gel images are displayed on top of each graph. aP < 0.05, bP = 0.06 for VCL and PCK2.
- Citation: Turroni S, Vitali B, Candela M, Gionchetti P, Rizzello F, Campieri M, Brigidi P. Antibiotics and probiotics in chronic pouchitis: A comparative proteomic approach. World J Gastroenterol 2010; 16(1): 30-41
- URL: https://www.wjgnet.com/1007-9327/full/v16/i1/30.htm
- DOI: https://dx.doi.org/10.3748/wjg.v16.i1.30


