Copyright
©2009 The WJG Press and Baishideng.
World J Gastroenterol. Dec 7, 2009; 15(45): 5669-5673
Published online Dec 7, 2009. doi: 10.3748/wjg.15.5669
Published online Dec 7, 2009. doi: 10.3748/wjg.15.5669
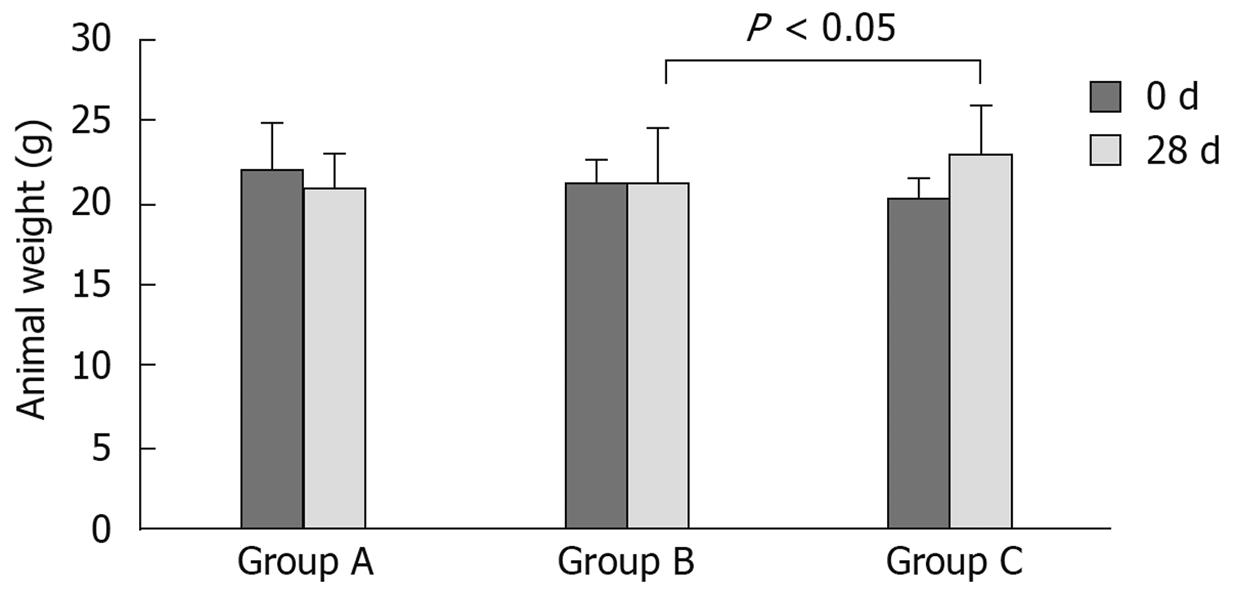
Figure 1 Animal weight alteration before and after the experiment.
The weight of each mouse was determined before drug administration and before sacrifice after 28 d of experimentation, respectively. One-way ANOVA analysis indicated that there was no significant weight change between day 0 and day 28 in all three groups. However, increased weight was observed in group C compared with group B after 28 d of experimentation. Group A: Normal control; Group B: Lamivudine; Group C: Emodin and Astragalus polysaccharides.
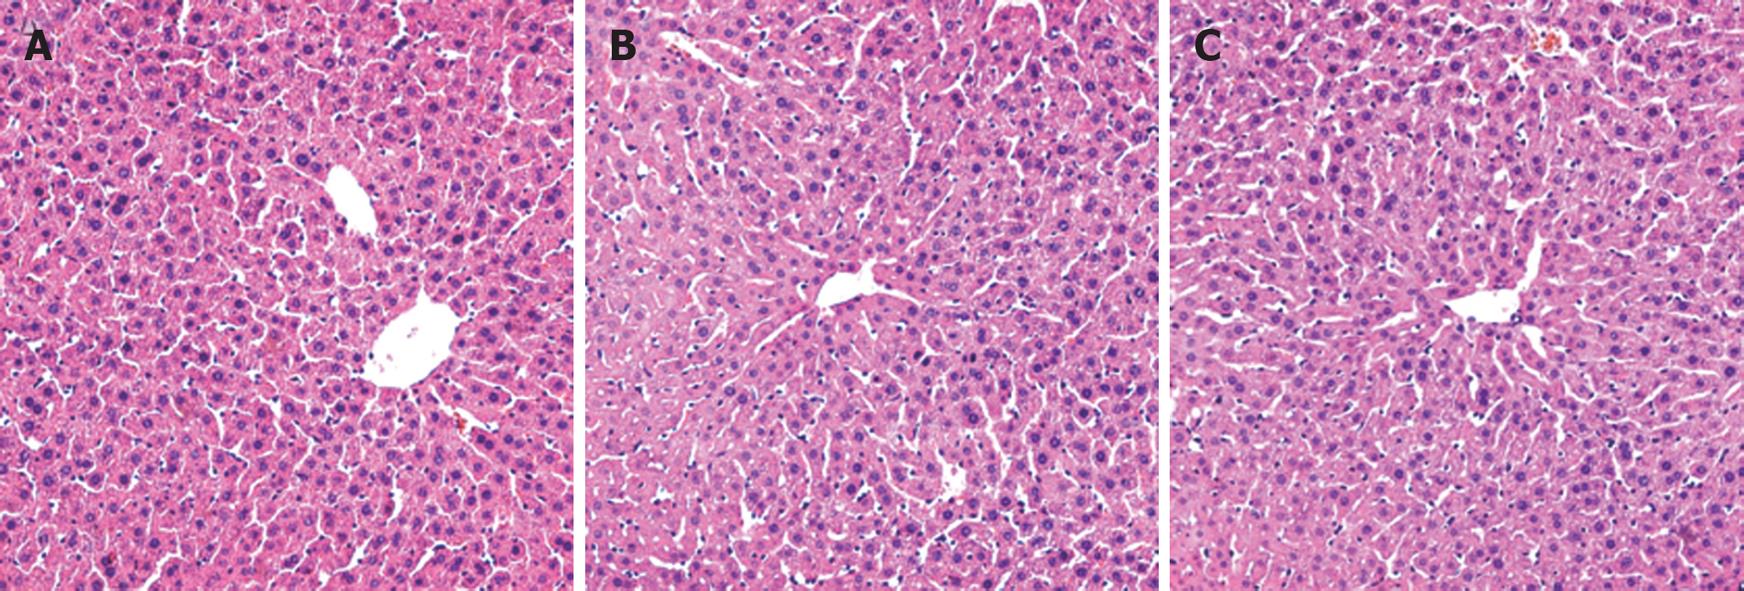
Figure 2 HE staining of liver tissue from different groups (Original magnification, × 200).
A: Normal control; B: Lamivudine; C: Emodin and Astragalus polysaccharides.
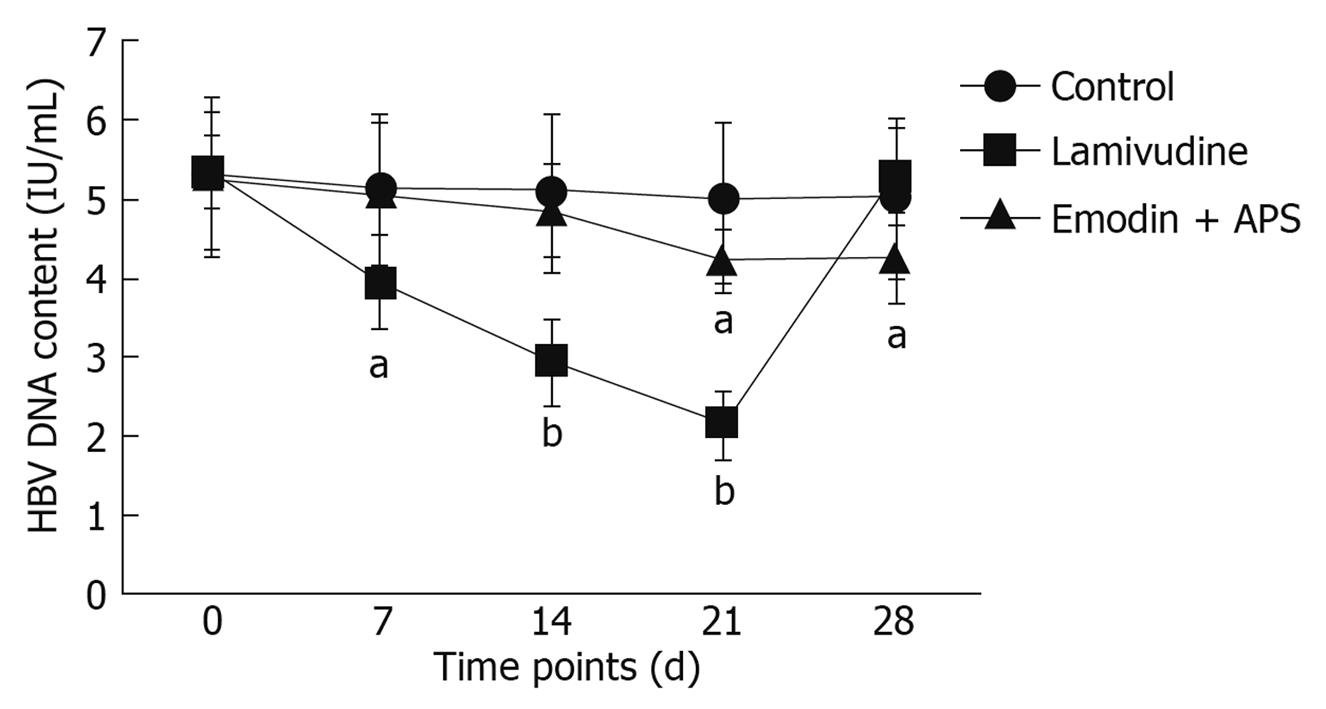
Figure 3 Hepatitis B virus (HBV) DNA levels in serum.
Mice were sacrificed at day 28 of the experiment. Blood was collected, serum was separated, and HBV DNA content was investigated using real-time PCR. Lower HBV DNA contents were observed in the lamivudine group except on day 28 of the experiment. Emodin + APS decreased serum HBV DNA content at day 21 and 28. Data was presented as mean ± SE (n = 19). aP < 0.05, bP < 0.01 vs the control group at the same time point.
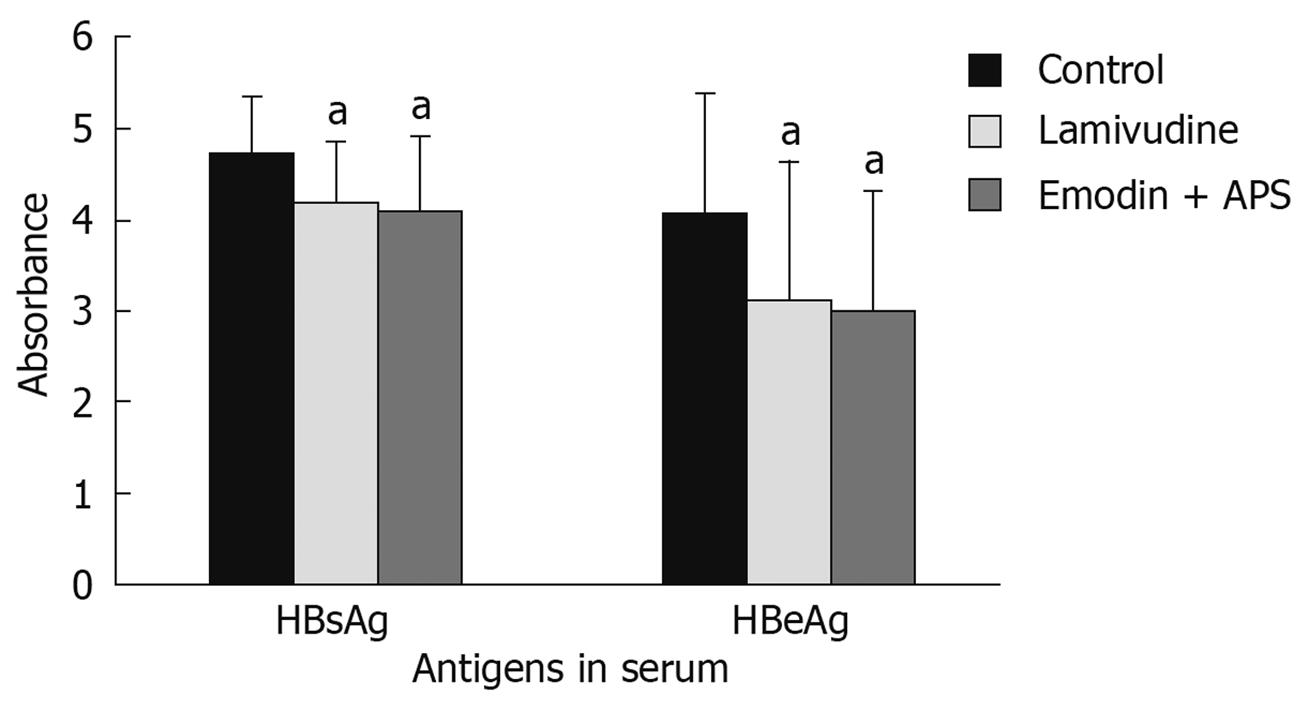
Figure 4 HBsAg and HBeAg levels in serum.
Mice were sacrificed at day 28 of the experiment. Blood was collected and serum was separated. HBsAg and HBeAg levels in serum were determined using ELISA. Lower HBsAg and HBeAg levels were observed in the lamivudine and emodin + APS groups. Data was presented as mean ± SE (n = 19). aP < 0.05 vs the control group.
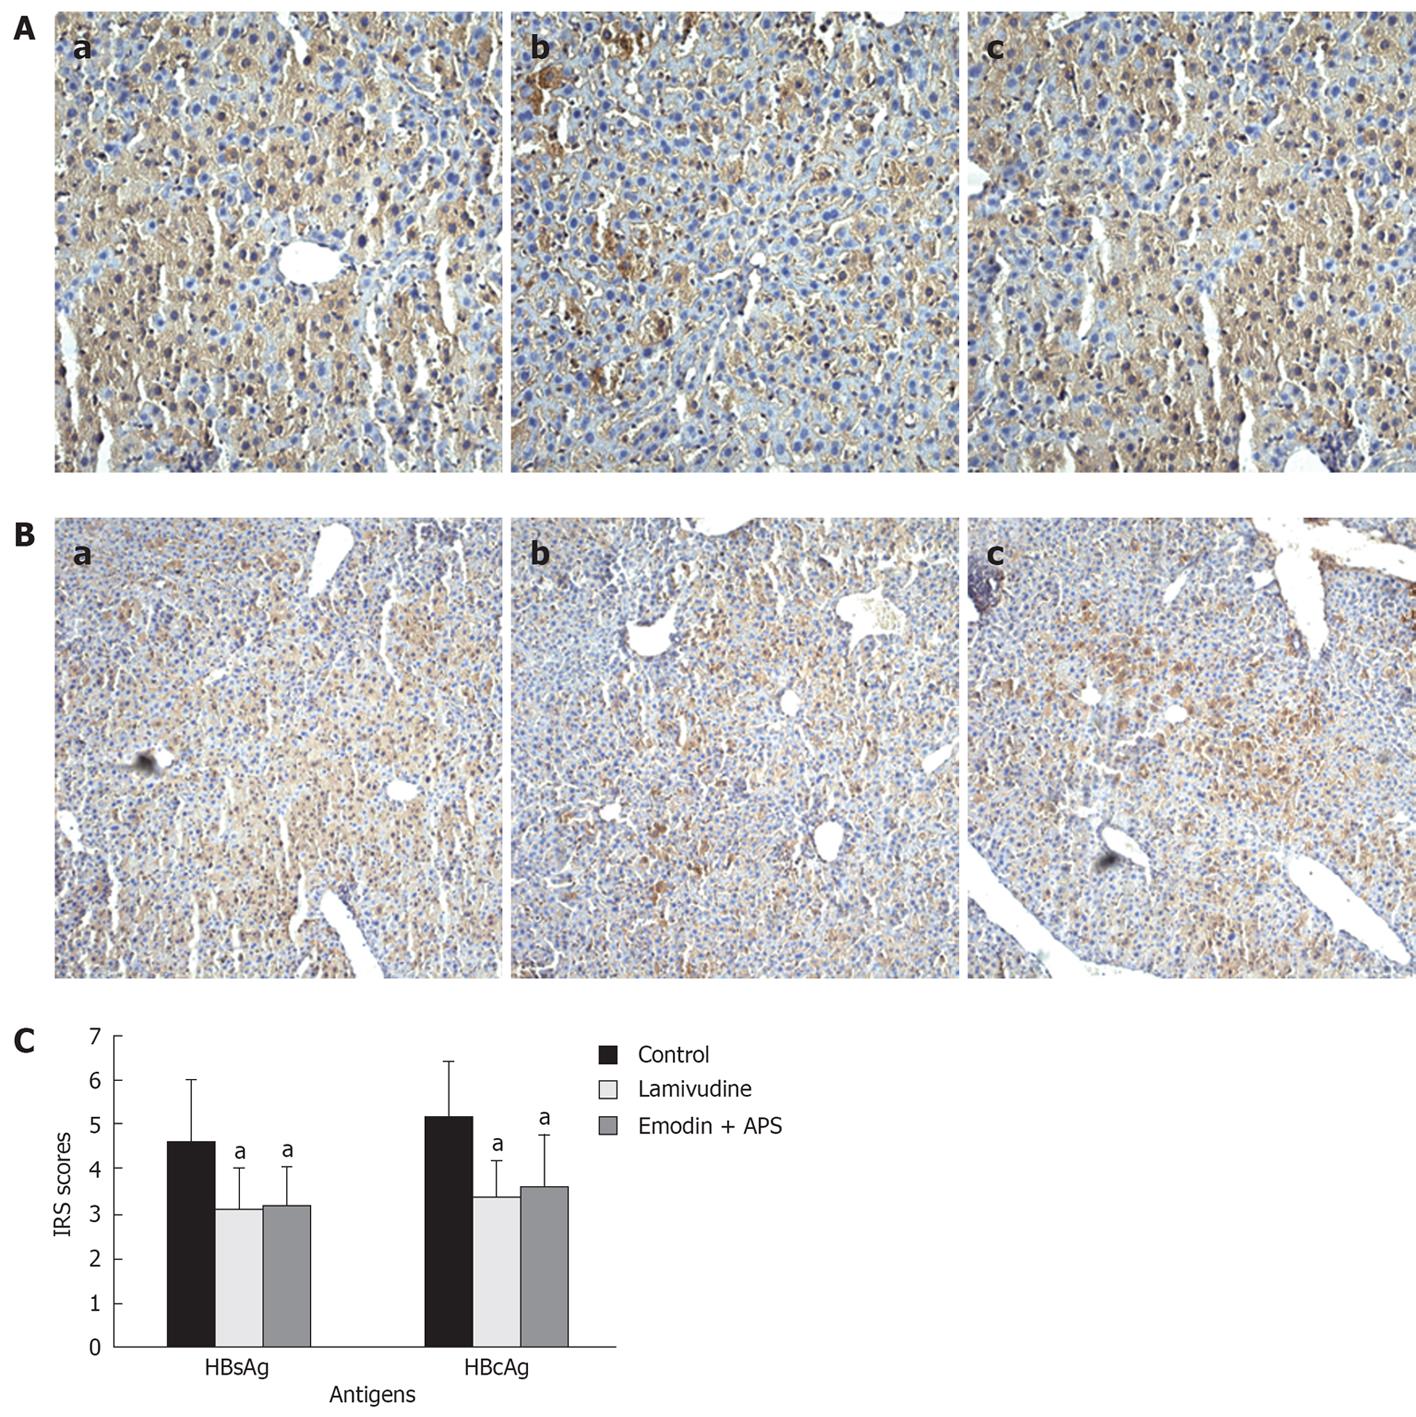
Figure 5 HBsAg and HBcAg expression in hepatocytes (original magnification, × 200).
Positive staining of HBsAg and HBcAg was brown or dark brown, and mainly localised in the cytoplasm. A: HBsAg; B: HBcAg; a: Control group; b: Lamivudine group; c: Emodin and Astragalus polysaccharides group; C: The immunohistochemical reaction score (IRS) was calculated according to the formula IRS = positive staining scores × intensity scores. Lower HBsAg and HBcAg expression were observed in the lamivudine and emodin + APS groups. Data was presented as mean ± SE. aP < 0.05 vs the control group.
- Citation: Dang SS, Jia XL, Song P, Cheng YA, Zhang X, Sun MZ, Liu EQ. Inhibitory effect of emodin and Astragalus polysaccharide on the replication of HBV. World J Gastroenterol 2009; 15(45): 5669-5673
- URL: https://www.wjgnet.com/1007-9327/full/v15/i45/5669.htm
- DOI: https://dx.doi.org/10.3748/wjg.15.5669


