Copyright
©2009 The WJG Press and Baishideng.
World J Gastroenterol. Dec 7, 2009; 15(45): 5669-5673
Published online Dec 7, 2009. doi: 10.3748/wjg.15.5669
Published online Dec 7, 2009. doi: 10.3748/wjg.15.5669
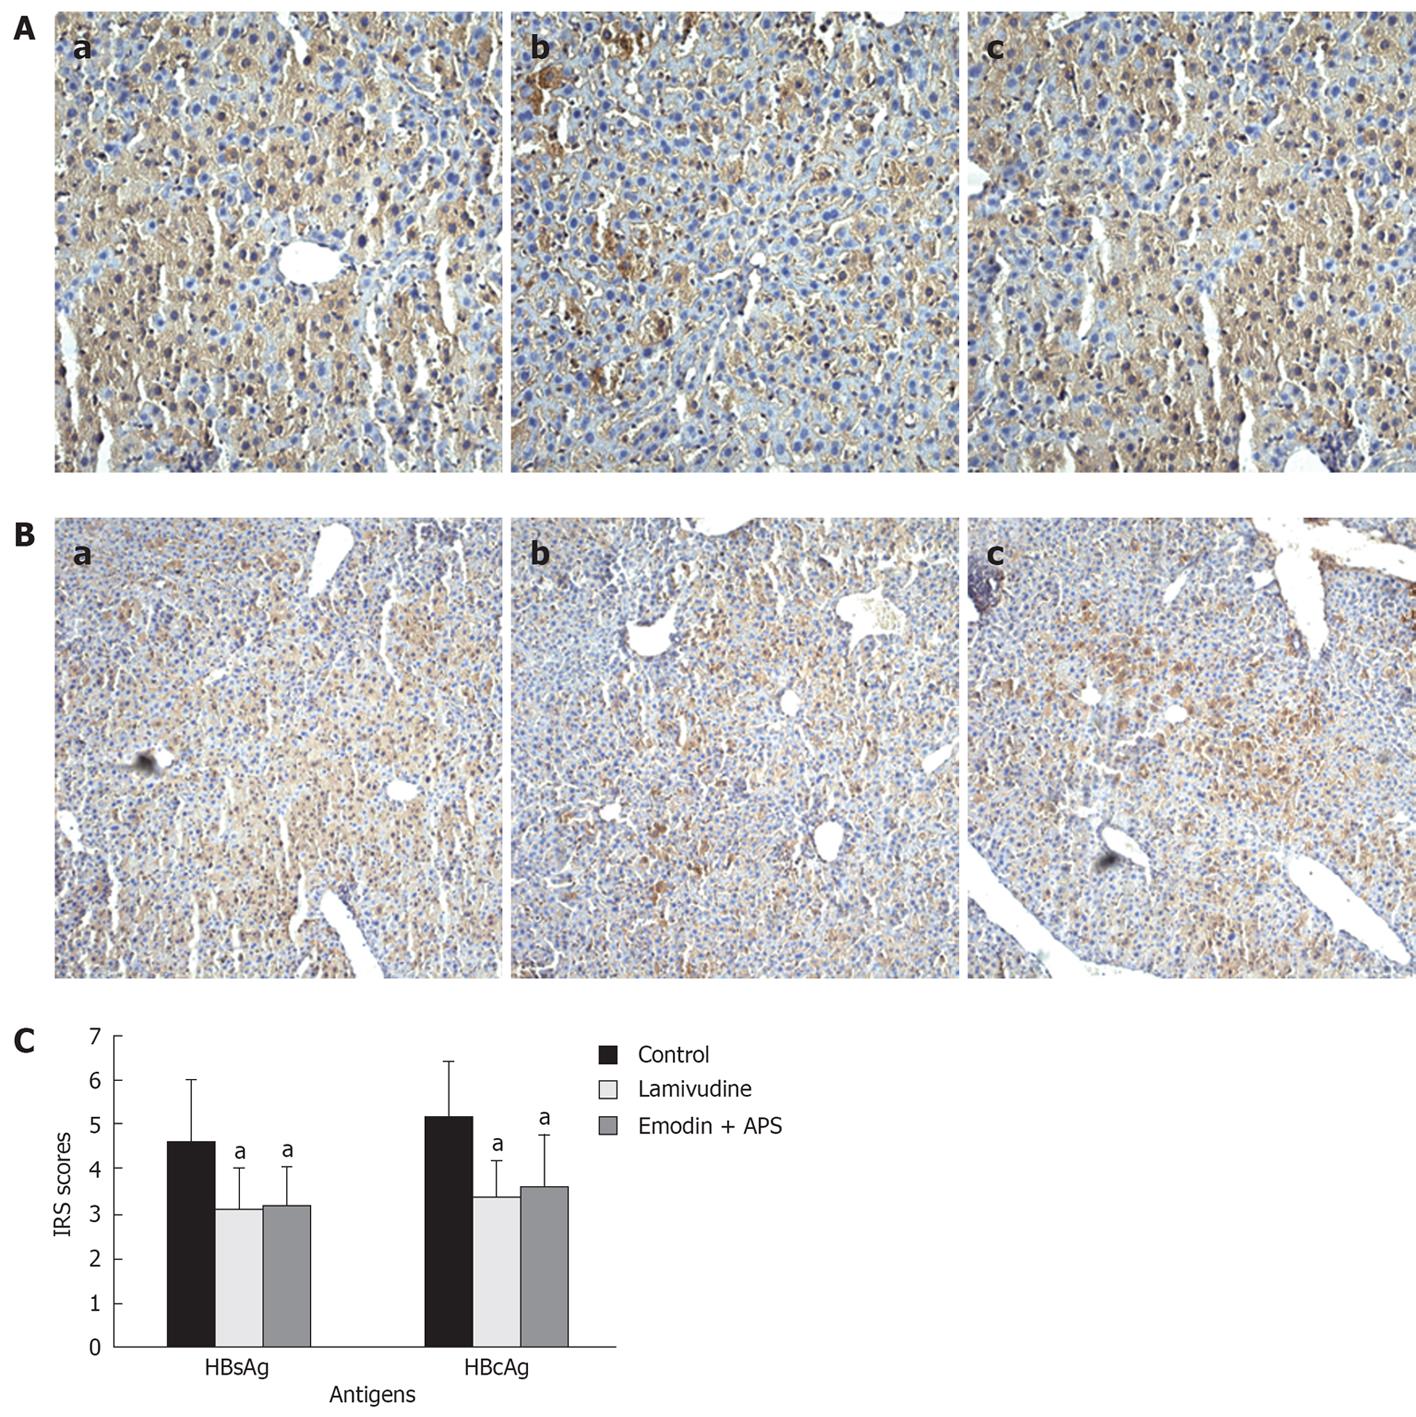
Figure 5 HBsAg and HBcAg expression in hepatocytes (original magnification, × 200).
Positive staining of HBsAg and HBcAg was brown or dark brown, and mainly localised in the cytoplasm. A: HBsAg; B: HBcAg; a: Control group; b: Lamivudine group; c: Emodin and Astragalus polysaccharides group; C: The immunohistochemical reaction score (IRS) was calculated according to the formula IRS = positive staining scores × intensity scores. Lower HBsAg and HBcAg expression were observed in the lamivudine and emodin + APS groups. Data was presented as mean ± SE. aP < 0.05 vs the control group.
- Citation: Dang SS, Jia XL, Song P, Cheng YA, Zhang X, Sun MZ, Liu EQ. Inhibitory effect of emodin and Astragalus polysaccharide on the replication of HBV. World J Gastroenterol 2009; 15(45): 5669-5673
- URL: https://www.wjgnet.com/1007-9327/full/v15/i45/5669.htm
- DOI: https://dx.doi.org/10.3748/wjg.15.5669


