Copyright
©2009 The WJG Press and Baishideng.
World J Gastroenterol. Sep 7, 2009; 15(33): 4126-4131
Published online Sep 7, 2009. doi: 10.3748/wjg.15.4126
Published online Sep 7, 2009. doi: 10.3748/wjg.15.4126
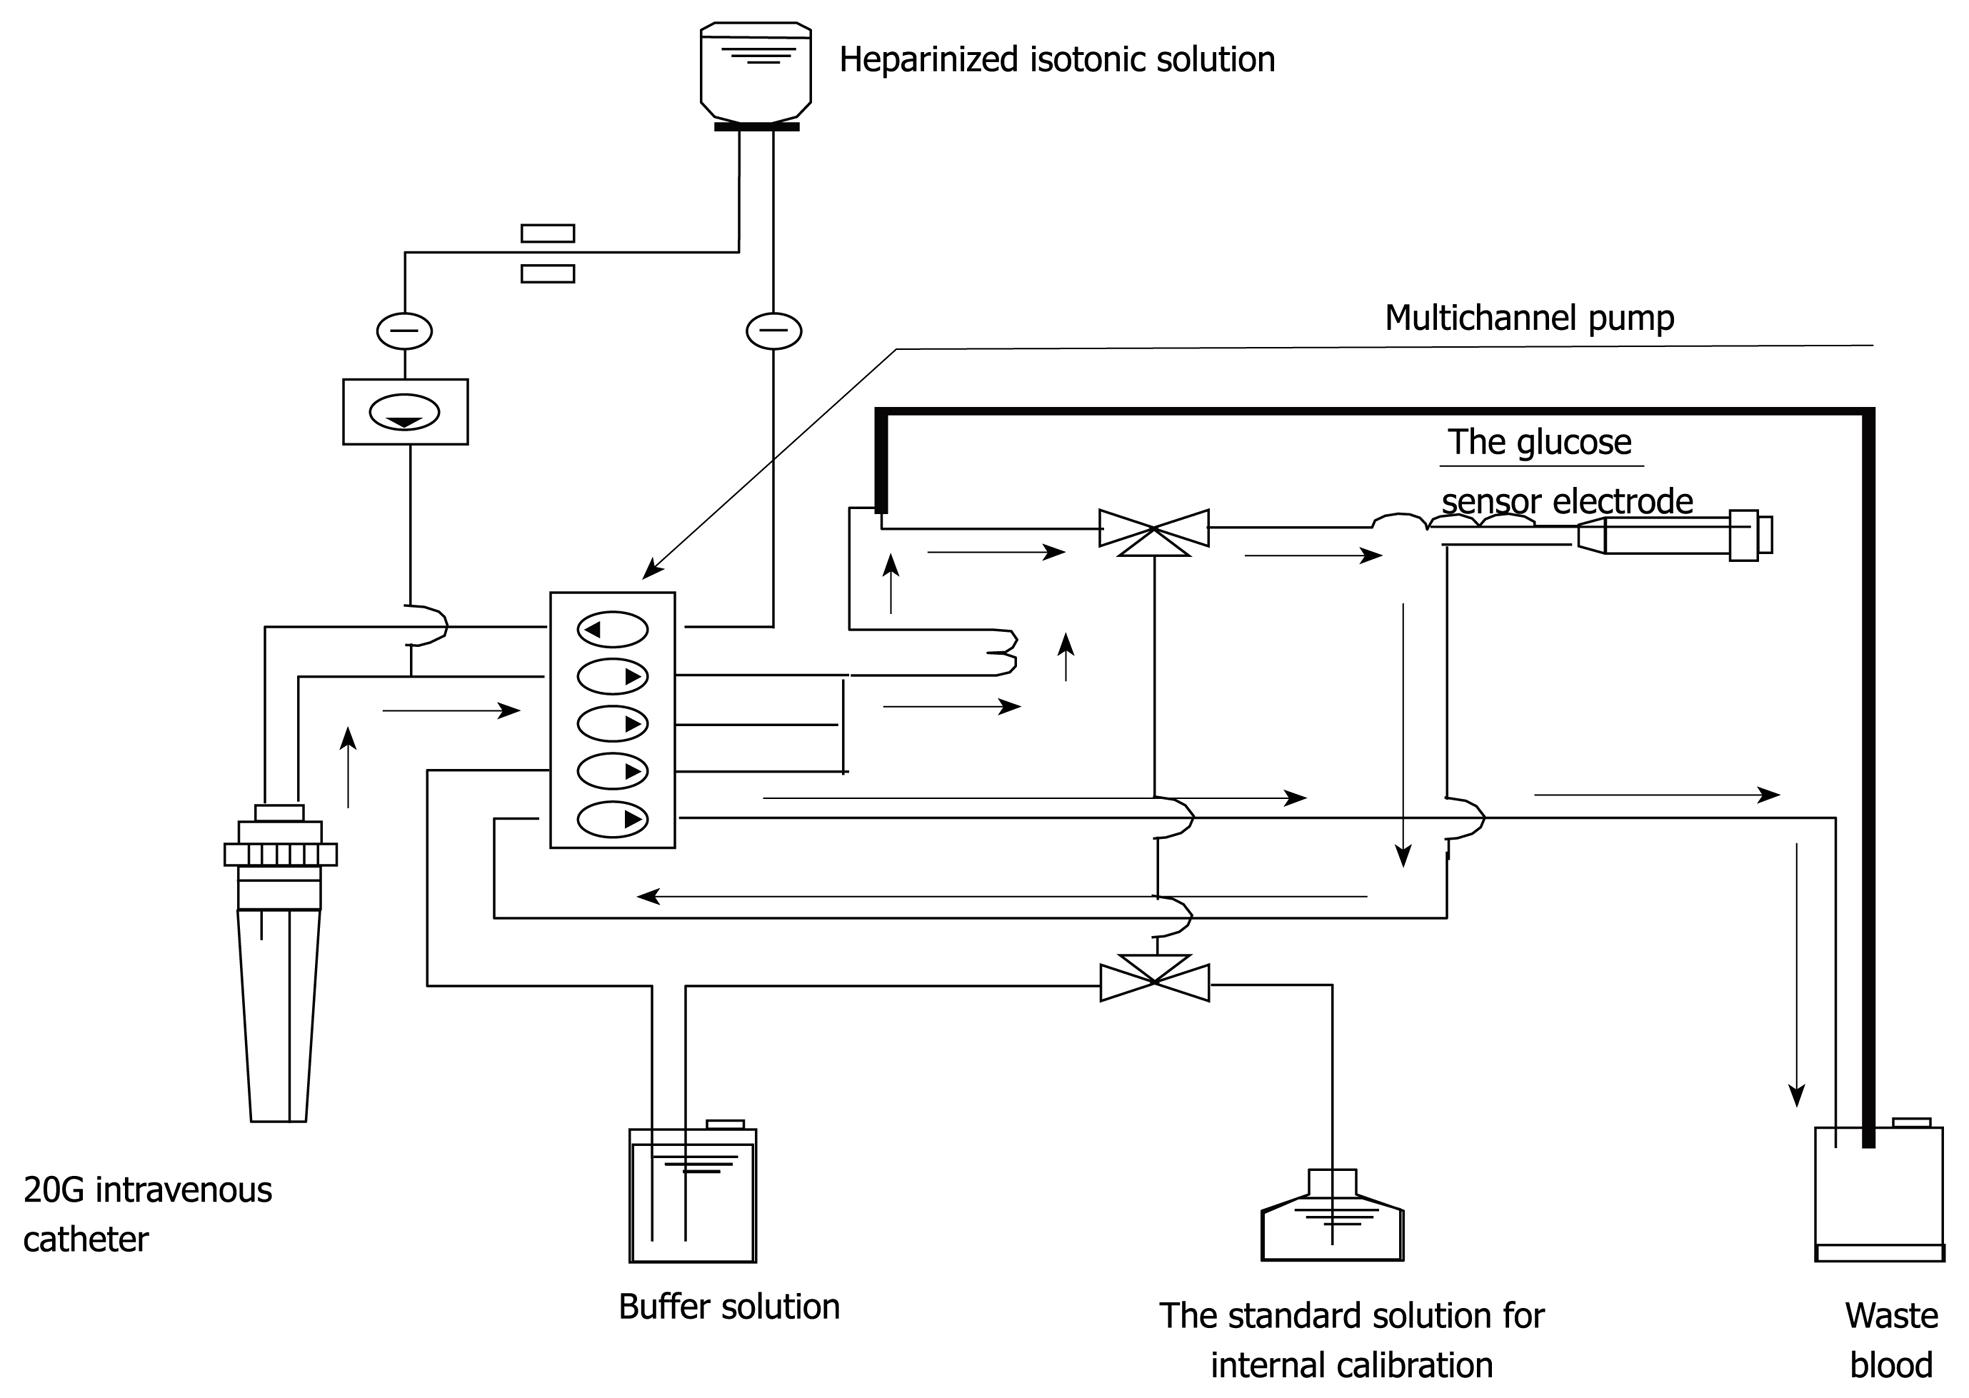
Figure 1 The whole circuit of the STG-22TM.
Arrows indicate the direction of blood sampling.
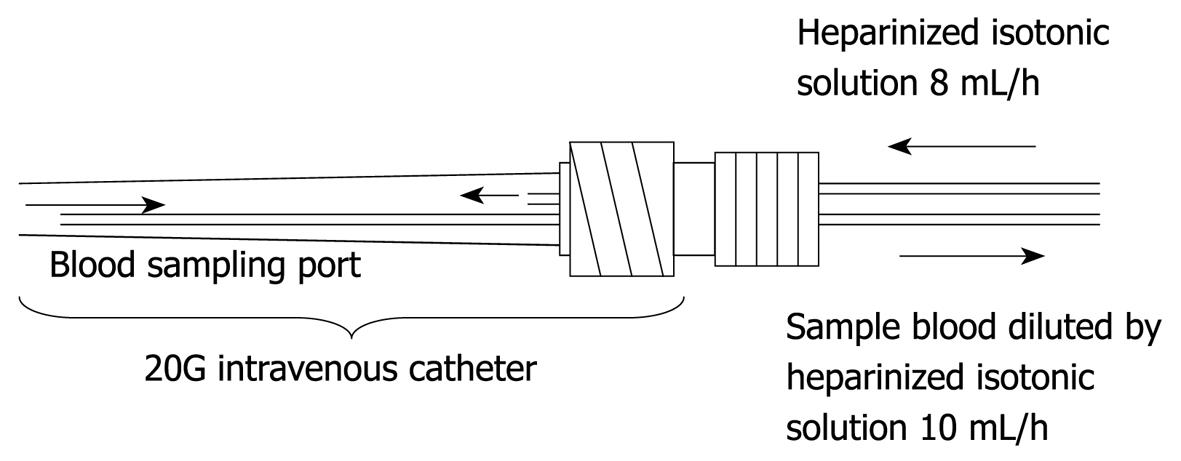
Figure 2 This figure shows the dual lumen catheter technique.
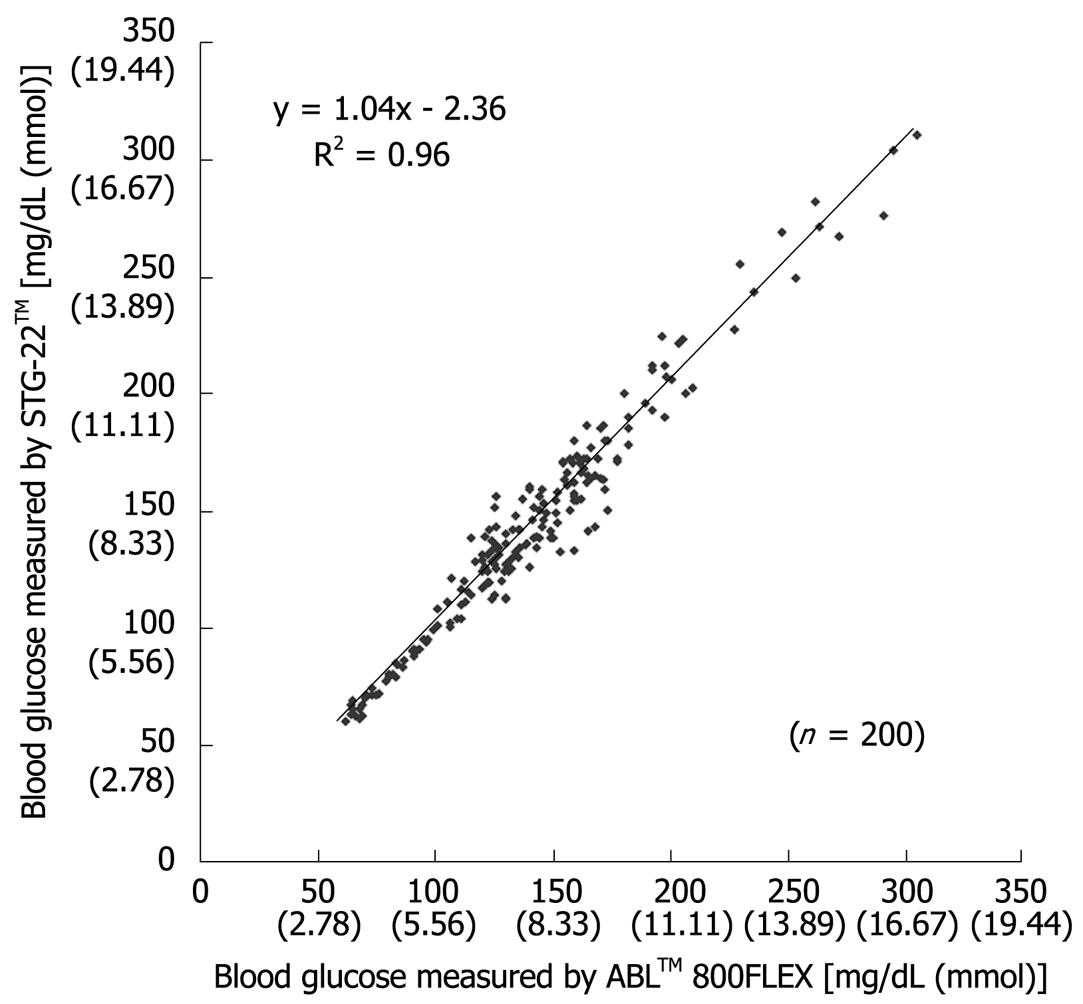
Figure 3 Scatter plot of individual blood glucose levels measured by both STG-22TM and ABLTM 800FLEX during surgery[20].
Figure 4 Scatter plot of individual blood glucose levels measured by both STG-22TM and ABLTM 800FLEX in post-surgical patients[21].
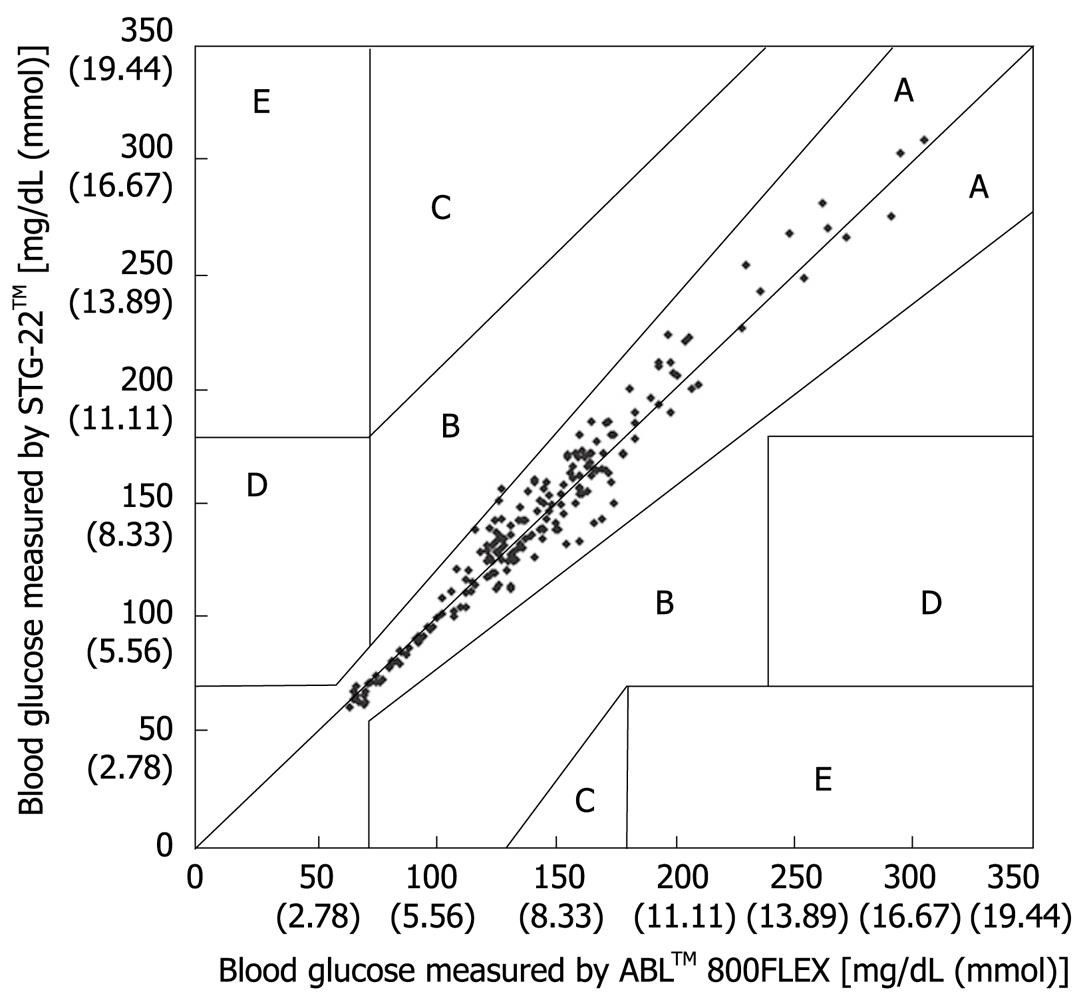
Figure 5 Error grid analysis for evaluation of blood glucose measured by STG-22TM compared with those measured by ABLTM 800FLEX.
Zone A, B: Accurate or acceptable; Zone C: Unnecessary corrections that could lead to a poor outcome; Zone D: Dangerous failure to detect and treat; Zone E: ‘Erroneous treatment’[21].
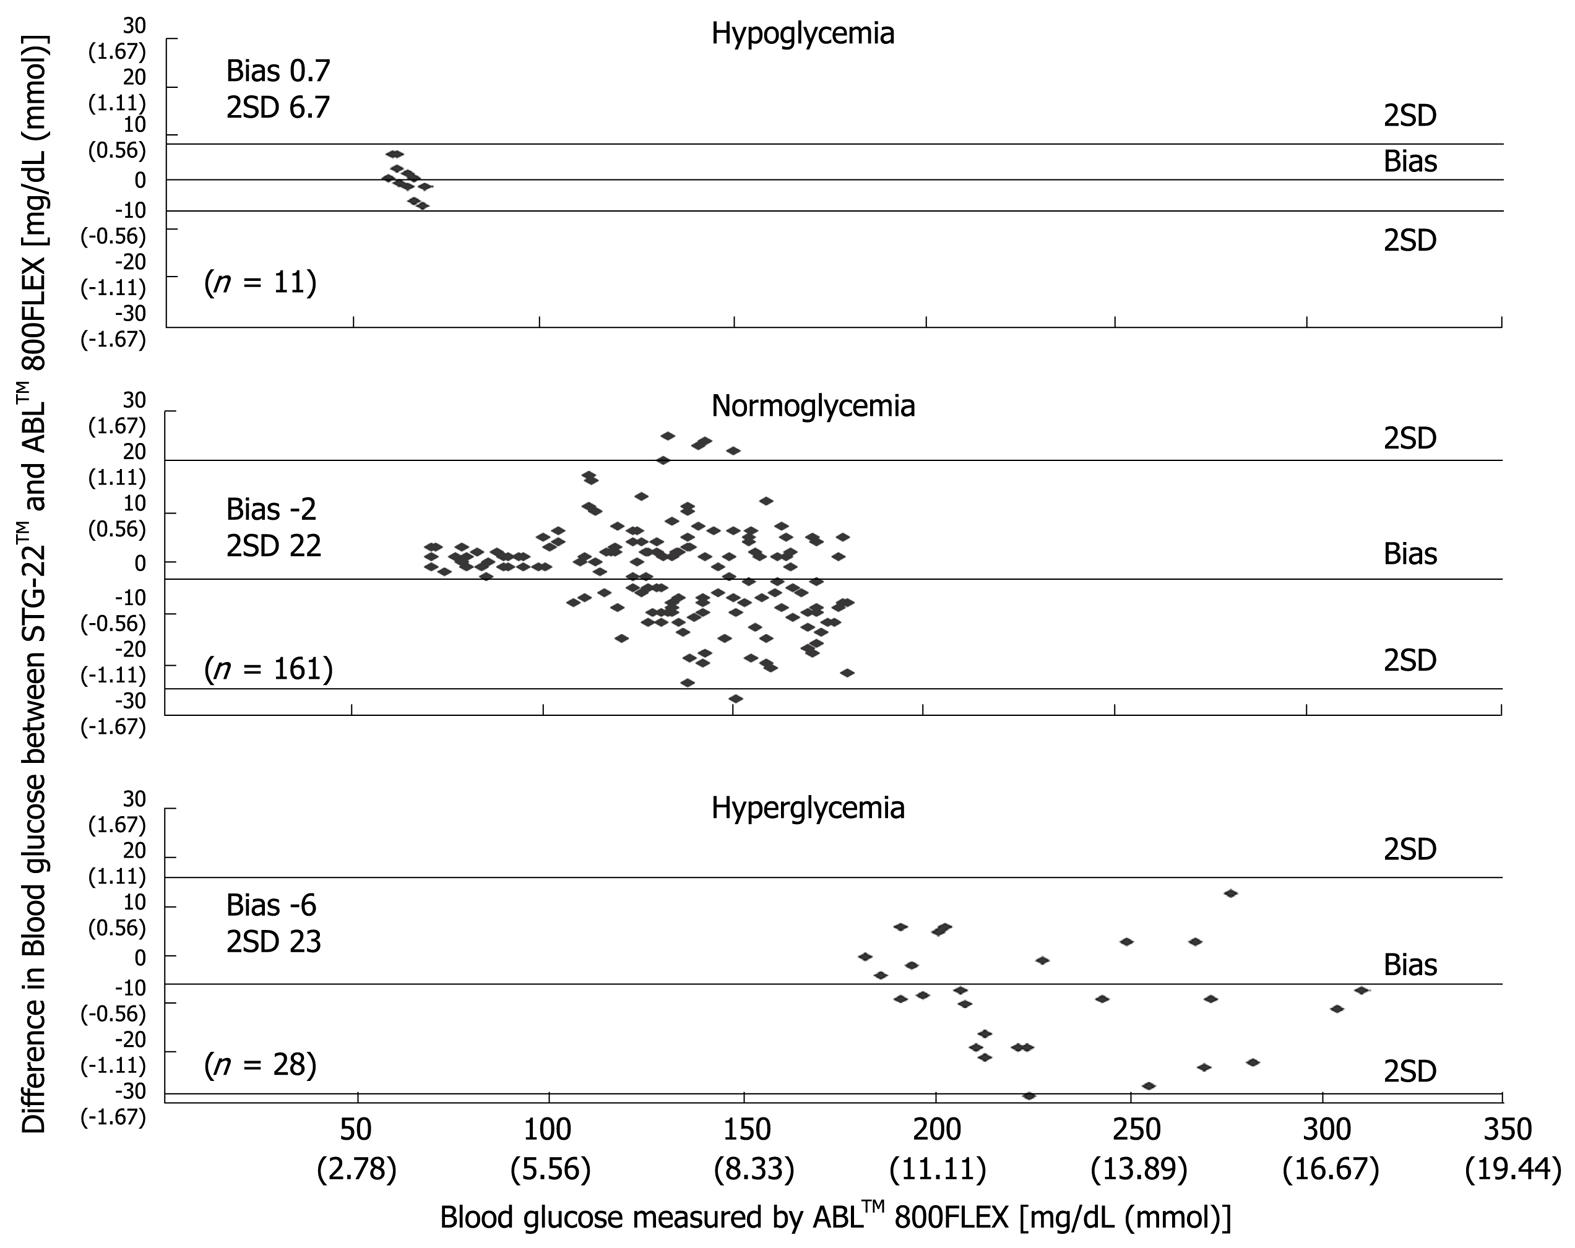
Figure 6 Bland-Altman plot of blood glucose measurements from STG-22TM and ABLTM 800FLEX[21].
- Citation: Yamashita K, Yatabe T. Intraoperative glycemic control procedures and the use of an artificial pancreas. World J Gastroenterol 2009; 15(33): 4126-4131
- URL: https://www.wjgnet.com/1007-9327/full/v15/i33/4126.htm
- DOI: https://dx.doi.org/10.3748/wjg.15.4126


