Copyright
©2009 The WJG Press and Baishideng.
World J Gastroenterol. Jan 21, 2009; 15(3): 300-309
Published online Jan 21, 2009. doi: 10.3748/wjg.15.300
Published online Jan 21, 2009. doi: 10.3748/wjg.15.300
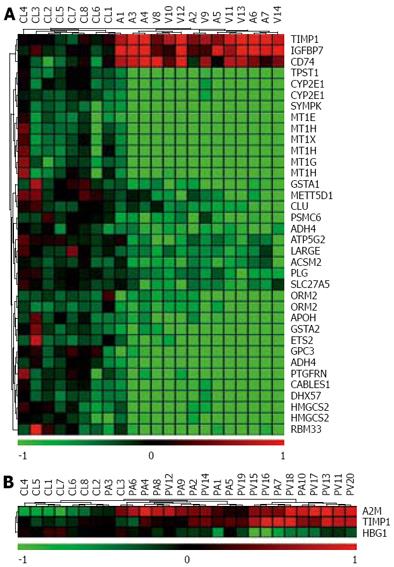
Figure 1 Clustering of cirrhosis from comparisons of transcript levels vs Cls.
Every transcript level expressed as a [level per patient/median level in CLs] was measured by microarray. The samples are shown as a dendrogram on top and the transcripts are listed vertically. Bottom scale bar (log2 scale): decreased (green), increased (red) or unchanged (black) transcript level. A: UHC was made in 14 HCC-free cirrhosis samples and 8 CLs, from 30 transcript levels first identified as cirrhosis markers in an HCC-free context. B: UHC was made with 20 peritumoral cirrhosis samples and 8 CLs, from 3 transcript levels identified as cirrhosis markers in an HCC context.
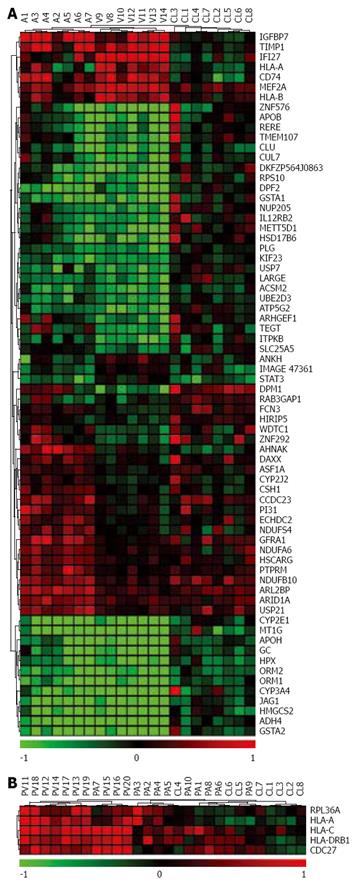
Figure 2 Clustering of cirrhosis samples from transcript levels.
Every transcript was measured by microarray and expressed as a [level per patient/median level in CLs]. The samples are shown as a dendrogram on top and the transcripts are listed vertically. Bottom scale bar (log2 scale): decreased (green), increased (red) or unchanged (black) transcript level. A: UHC was made in 14 HCC-free cirrhosis samples and eight CLs, from 70 altered transcript levels first identified as markers of HCC-free cirrhosis. A or V, alcoholism-related or HCV-related etiology; B: UHC was made in 20 HCC-associated cirrhosis samples and eight CLs, from five transcript levels identified by t-test adjusted by Bonferroni's correction. PA or PV, perinodular cirrhosis, with an alcoholism-related or HCV-related etiology, respectively.
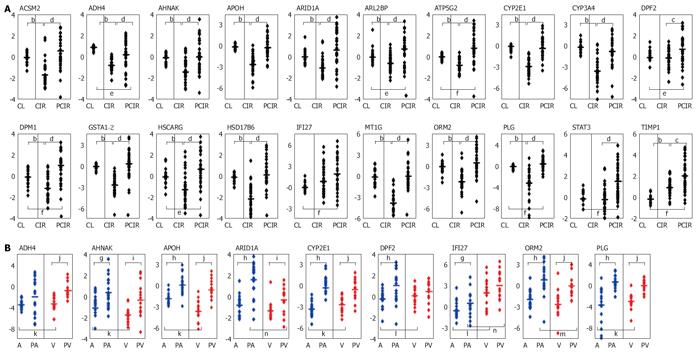
Figure 3 Changes in transcript levels in cirrhosis.
The transcripts are those listed in Table 3, footnote 2F. Their levels were determined by real-time qRT-PCR in training and testing samples (18 CLs, 34 HCC-free cirrhosis and 35 peritumoral cirrhosis). Every transcript name is noted on top and its level per cirrhosis type is expressed on the ordinate as a log2 [level in type/median level in CLs]. The mean value of transcripts is shown as an horizontal bar. A : CL: control; CIR: HCC-free cirrhosis (regardless of etiology); PCIR: perinodular cirrhosis (regardless of etiology). Significant difference between CIR and CL (aP < 0.05, bP < 0.01, Mann-Whitney U test), between CIR and PCIR (cP < 0.05, dP < 0.01) and between PCIR and CL (eP < 0.05, fP < 0.01). B: Transcripts separated per etiology : alcoholism (blue), HCV (red); A or V: alcoholic or viral, HCC-free cirrhosis; PA or PV: perinodular, alcoholic or viral cirrhosis. Significant difference between A and PA (gP < 0.05, hP < 0.01), between V and PV (iP < 0.05, jP < 0.01), between A and V (kP < 0.05, lP < 0.01) and between PA and PV (mP < 0.05, nP < 0.01).
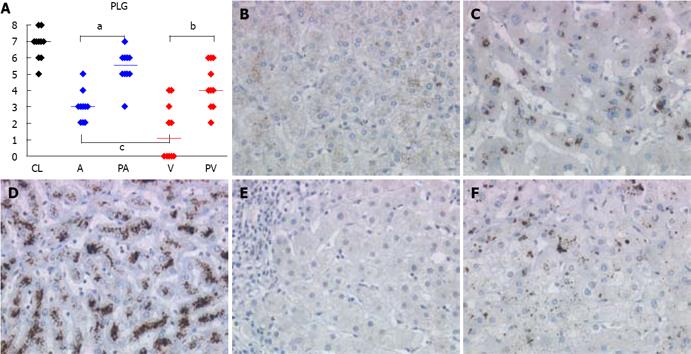
Figure 4 PLG protein expression in control liver, HCC-free and HCC-associated cirrhosis.
The PLG protein levels were determined by immunohistochemistry (magnification x 20). A: Every protein level (IP score) per cirrhosis type is expressed on the ordinate. The mean value of protein level is shown as an horizontal bar. The samples abbreviations are the same as for Figure 3. Significant differences between A and PA (aP < 0.05), between V and PV (bP < 0.05), between A and V (cP < 0.05). B-F: PLG immunostaining of hepatic sections corresponding to alcoholic HCC-free cirrhosis (B), alcoholic HCC-associated cirrhosis (C), control liver (D), HCV-related HCC-free cirrhosis (E) and HCV-related HCC-associated cirrhosis (F).
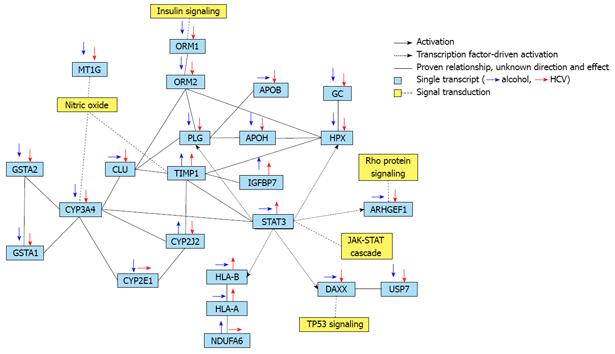
Figure 5 Networks of etiology-independent or dependent transcript regulations in HCC-free cirrhosis.
From 70 transcripts with a significantly different expression between alcoholic-associated vs HCV-associated cirrhosis vs CLs (P < 0.05, as in Figure 3), 23 transcripts (boxes) associated with different pathways were identified in Bibliosphere. In a context of HCC-free cirrhosis, etiology-specific arrows (alcoholism, blue; HCV, red) above the transcript indicates the direction of regulation: upward, downward or horizontal arrow: up-regulation, down-regulation or unchanged regulation. For a transcript with an up- (down-) regulation in both etiologies, the highest (lowest) arrow indicates the most marked dysregulation.
- Citation: Caillot F, Derambure C, Bioulac-Sage P, François A, Scotte M, Goria O, Hiron M, Daveau M, Salier JP. Transient and etiology-related transcription regulation in cirrhosis prior to hepatocellular carcinoma occurrence. World J Gastroenterol 2009; 15(3): 300-309
- URL: https://www.wjgnet.com/1007-9327/full/v15/i3/300.htm
- DOI: https://dx.doi.org/10.3748/wjg.15.300


