Copyright
©2009 The WJG Press and Baishideng.
World J Gastroenterol. Jan 21, 2009; 15(3): 300-309
Published online Jan 21, 2009. doi: 10.3748/wjg.15.300
Published online Jan 21, 2009. doi: 10.3748/wjg.15.300
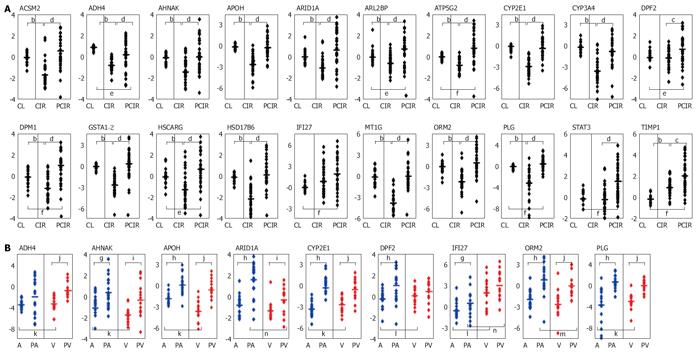
Figure 3 Changes in transcript levels in cirrhosis.
The transcripts are those listed in Table 3, footnote 2F. Their levels were determined by real-time qRT-PCR in training and testing samples (18 CLs, 34 HCC-free cirrhosis and 35 peritumoral cirrhosis). Every transcript name is noted on top and its level per cirrhosis type is expressed on the ordinate as a log2 [level in type/median level in CLs]. The mean value of transcripts is shown as an horizontal bar. A : CL: control; CIR: HCC-free cirrhosis (regardless of etiology); PCIR: perinodular cirrhosis (regardless of etiology). Significant difference between CIR and CL (aP < 0.05, bP < 0.01, Mann-Whitney U test), between CIR and PCIR (cP < 0.05, dP < 0.01) and between PCIR and CL (eP < 0.05, fP < 0.01). B: Transcripts separated per etiology : alcoholism (blue), HCV (red); A or V: alcoholic or viral, HCC-free cirrhosis; PA or PV: perinodular, alcoholic or viral cirrhosis. Significant difference between A and PA (gP < 0.05, hP < 0.01), between V and PV (iP < 0.05, jP < 0.01), between A and V (kP < 0.05, lP < 0.01) and between PA and PV (mP < 0.05, nP < 0.01).
- Citation: Caillot F, Derambure C, Bioulac-Sage P, François A, Scotte M, Goria O, Hiron M, Daveau M, Salier JP. Transient and etiology-related transcription regulation in cirrhosis prior to hepatocellular carcinoma occurrence. World J Gastroenterol 2009; 15(3): 300-309
- URL: https://www.wjgnet.com/1007-9327/full/v15/i3/300.htm
- DOI: https://dx.doi.org/10.3748/wjg.15.300


