Copyright
©2009 The WJG Press and Baishideng.
World J Gastroenterol. Jan 14, 2009; 15(2): 160-168
Published online Jan 14, 2009. doi: 10.3748/wjg.15.160
Published online Jan 14, 2009. doi: 10.3748/wjg.15.160
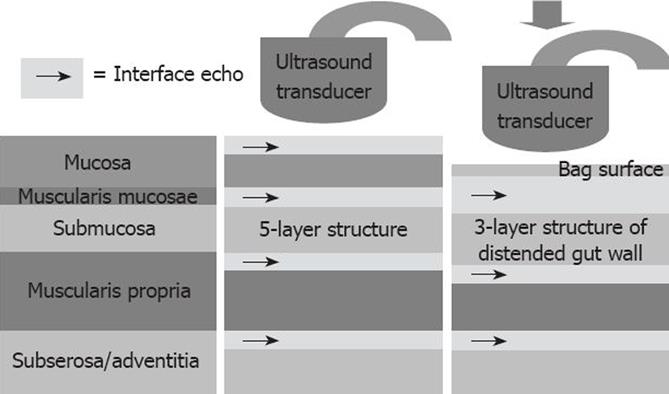
Figure 1 The principles of endosonography.
The histological gastrointestinal wall layers (left) are correlated to the typical layered ultrasound appearance of the gastrointestinal wall (middle). The 5-layered appearance is due to the addition of several interface echoes at the tissue interfaces. During compression or distension the wall is further stretched (including mucosal unfolding) which together usually obscures the second echo-rich mucosal layer. Hence, the wall appears 3-layered (see Figure 2).
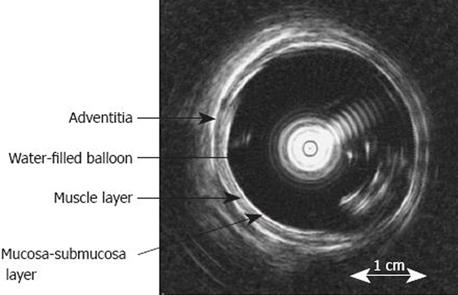
Figure 2 Cross-sectional endosonographic image of the distended distal oesophagus allows identification of three oesophageal sub-layers, i.
e. mucosa-submucosa, muscle and adventitia. The white shadows inside the water-filled bag (4-5 o’clock) represent artefacts due to convulsions of the water-filled balloon, which results in reduced image quality at low degrees of distension. Modified from [17].
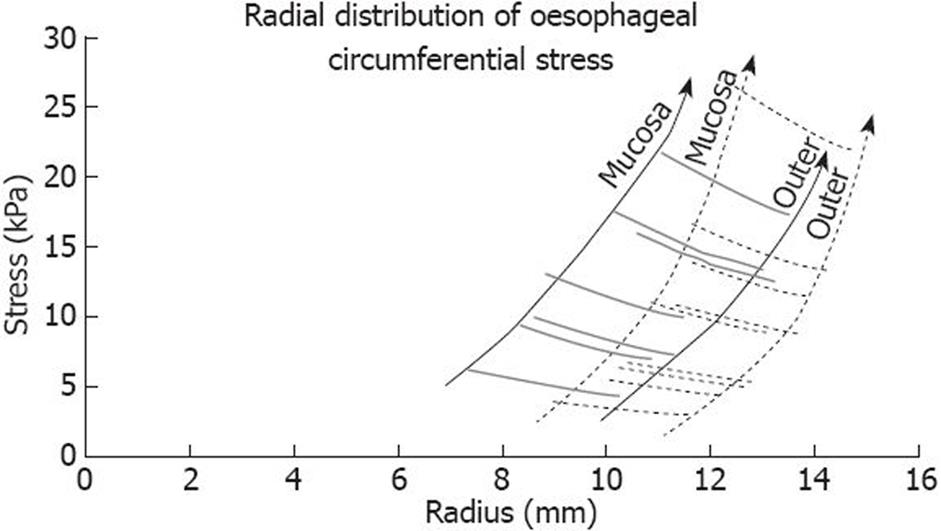
Figure 3 The oesophageal stress is calculated based on endosonography images and manometry.
The alignment of solid curves represents the oesophageal stress profiles during oesophageal distension in a healthy volunteer. The alignment of dashed curves represents distension during butylscopolamine smooth muscle relaxation. As the oesophagus distends the inner radius and stress increases, i.e. the left end of the curves shift to the right and upwards. At high degrees of distension the steepness of the stress profile increases. Oesophageal relaxation shifts the alignment of the stress profiles to the right. Modified from [17].
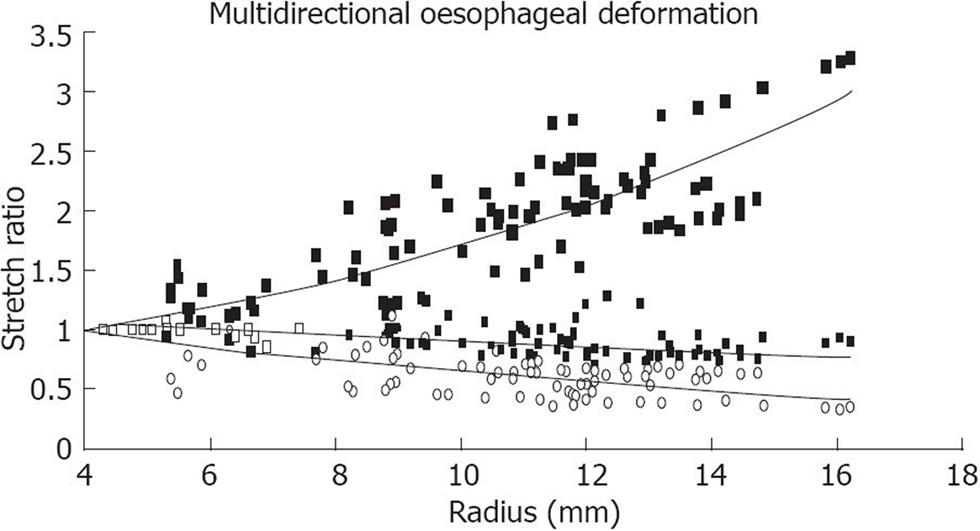
Figure 4 The circumferential, radial and longitudinal deformation of the oesophageal muscle layer is here described as the stretch ratio and as a function of the radius.
The stretch ratio and radius are calculated based on endosonography. Data are from 12 healthy volunteers and shows a tensile circumferential stretch, radial compression and longitudinal shortening. Modified from [17].
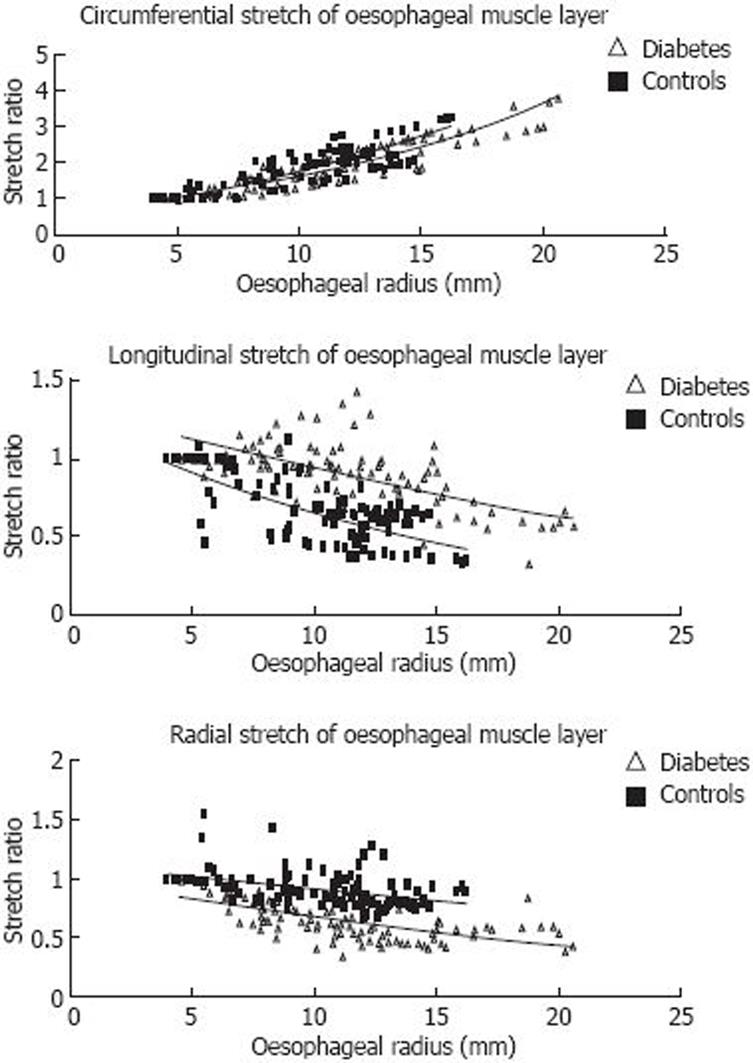
Figure 5 The graphs show the effect of diabetes on deformation of the oesophagus.
The distension-induced change in oesophageal circumferential, longitudinal and radial deformation (stretch ratio) are calculated based on endosonography and illustrated as a function of the oesophageal radius. The curves were obtained during smooth muscle relaxation with butylscopolamine. The data points represent multiple measuring points during distension in diabetic patients and controls. Exponential trend lines (solid lines) of the diabetic patients and controls are shown. Oesophageal shortening during distension was clearly reduced in the diabetic patients while the radial stretch was decreased. Modified from [20].
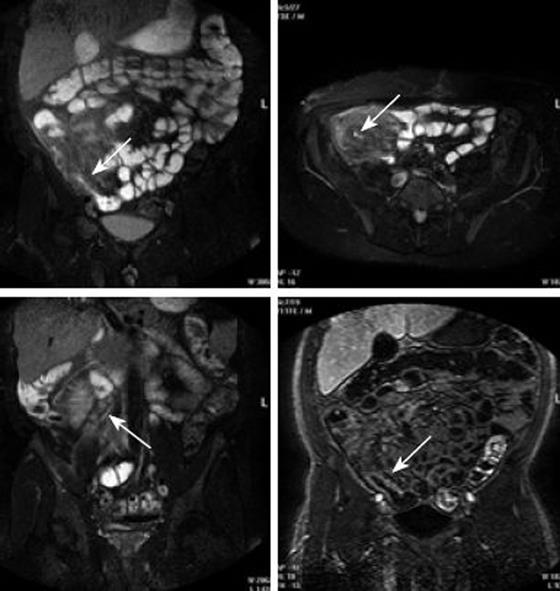
Figure 6 MRI of Crohn’s disease.
The coronal and axial (upper panel) fat-saturated T2-weighted MRI display marked wall thickening, mucosal irregularity and stenosis of the terminal ileum (arrows). Advanced mesenteric inflammation with hypervascularity and enlarged lymph nodes (arrow) are visualised on coronal fat-saturated T2-weighted MRI (lower left). Coronal T1-weighted MRI (lower right) shows clear wall enhancement (arrow). Modified from [36].
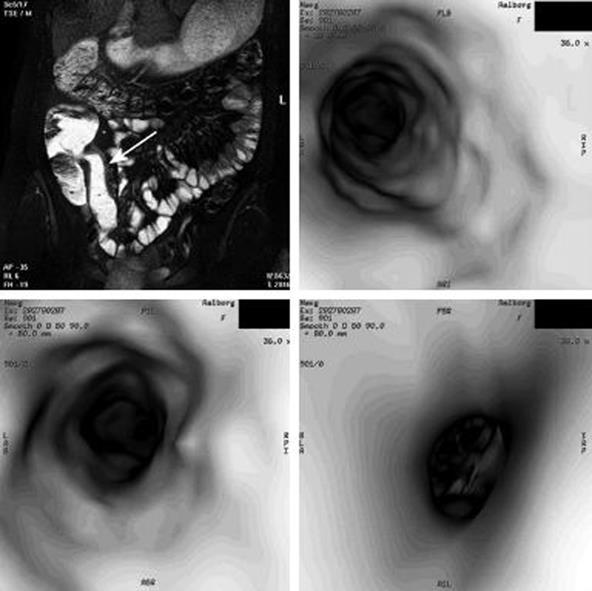
Figure 7 MRI of Crohn’s disease.
Virtual endoscopy views of the displayed diseased small bowel segment (arrow) shows mucosal nodularity, ileo-caecal narrowing and minor prestenotic dilatation. Modified from [36].
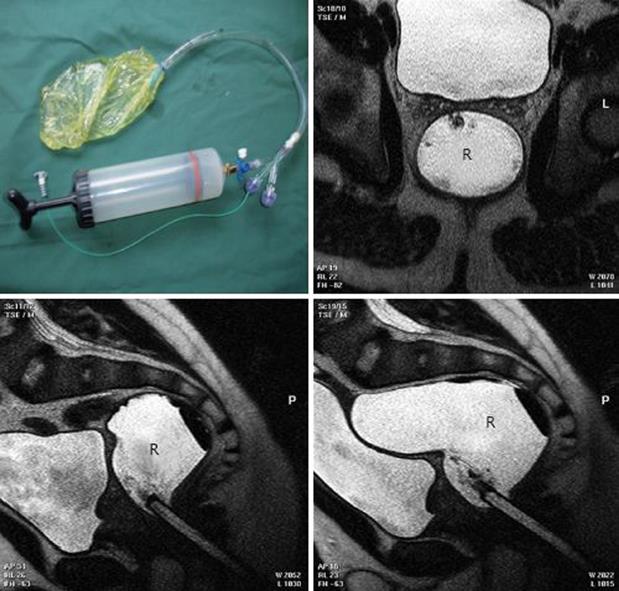
Figure 8 Stepwise distension of water filled balloon with simultaneous MRI and pressure recording.
The rectal probe (upper left) allows rectal water distension and pressure measurement. MRI shows the distended water-filled bag in the rectum (R). The sagittal MRI (lower panel) shows the distension, elongation and relation to neighbouring structures at 100 mL and 300 mL inside the bag. Modified from [50].
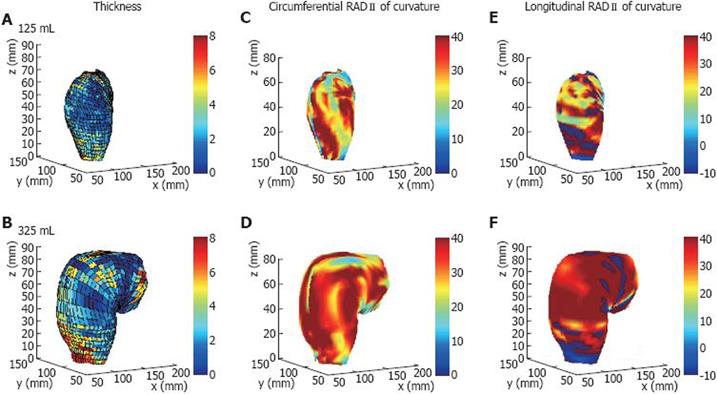
Figure 9 3D models of the rectum based on MRI and pressure recordings.
The 3D distribution of the rectal wall thickness (A-B), circumferential (C-D) and longitudinal (E-F) principal radii of curvatures in one healthy volunteer at infused volumes of 125 mL (A, C, E) and 325 mL (B, D, F). The change in colour from blue to red during bag distension indicates an increase in rectal wall thickness or radius of curvature, i.e. increase in diameter. Modified from [50].
- Citation: Frøkjær JB, Drewes AM, Gregersen H. Imaging of the gastrointestinal tract-novel technologies. World J Gastroenterol 2009; 15(2): 160-168
- URL: https://www.wjgnet.com/1007-9327/full/v15/i2/160.htm
- DOI: https://dx.doi.org/10.3748/wjg.15.160


