Copyright
©2009 The WJG Press and Baishideng.
World J Gastroenterol. Jan 14, 2009; 15(2): 160-168
Published online Jan 14, 2009. doi: 10.3748/wjg.15.160
Published online Jan 14, 2009. doi: 10.3748/wjg.15.160
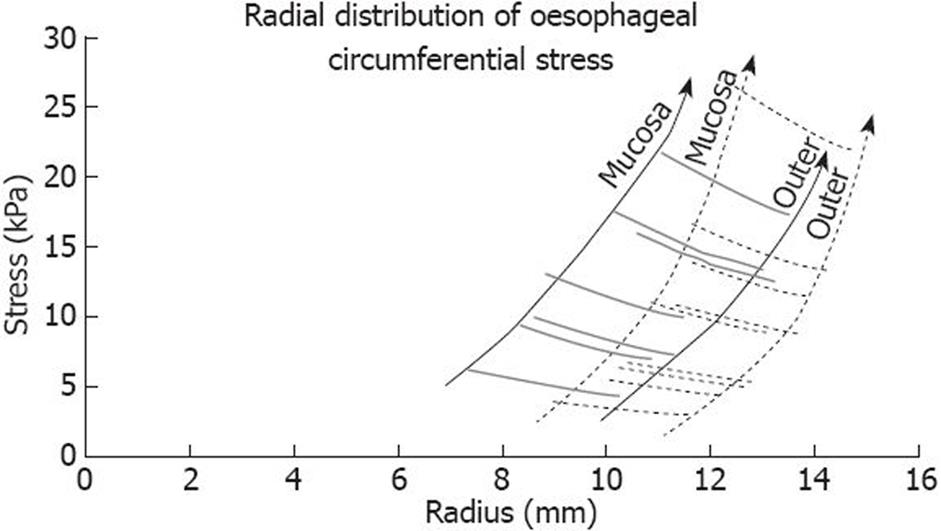
Figure 3 The oesophageal stress is calculated based on endosonography images and manometry.
The alignment of solid curves represents the oesophageal stress profiles during oesophageal distension in a healthy volunteer. The alignment of dashed curves represents distension during butylscopolamine smooth muscle relaxation. As the oesophagus distends the inner radius and stress increases, i.e. the left end of the curves shift to the right and upwards. At high degrees of distension the steepness of the stress profile increases. Oesophageal relaxation shifts the alignment of the stress profiles to the right. Modified from [17].
- Citation: Frøkjær JB, Drewes AM, Gregersen H. Imaging of the gastrointestinal tract-novel technologies. World J Gastroenterol 2009; 15(2): 160-168
- URL: https://www.wjgnet.com/1007-9327/full/v15/i2/160.htm
- DOI: https://dx.doi.org/10.3748/wjg.15.160


