Copyright
©2009 The WJG Press and Baishideng.
World J Gastroenterol. Apr 28, 2009; 15(16): 1990-1998
Published online Apr 28, 2009. doi: 10.3748/wjg.15.1990
Published online Apr 28, 2009. doi: 10.3748/wjg.15.1990
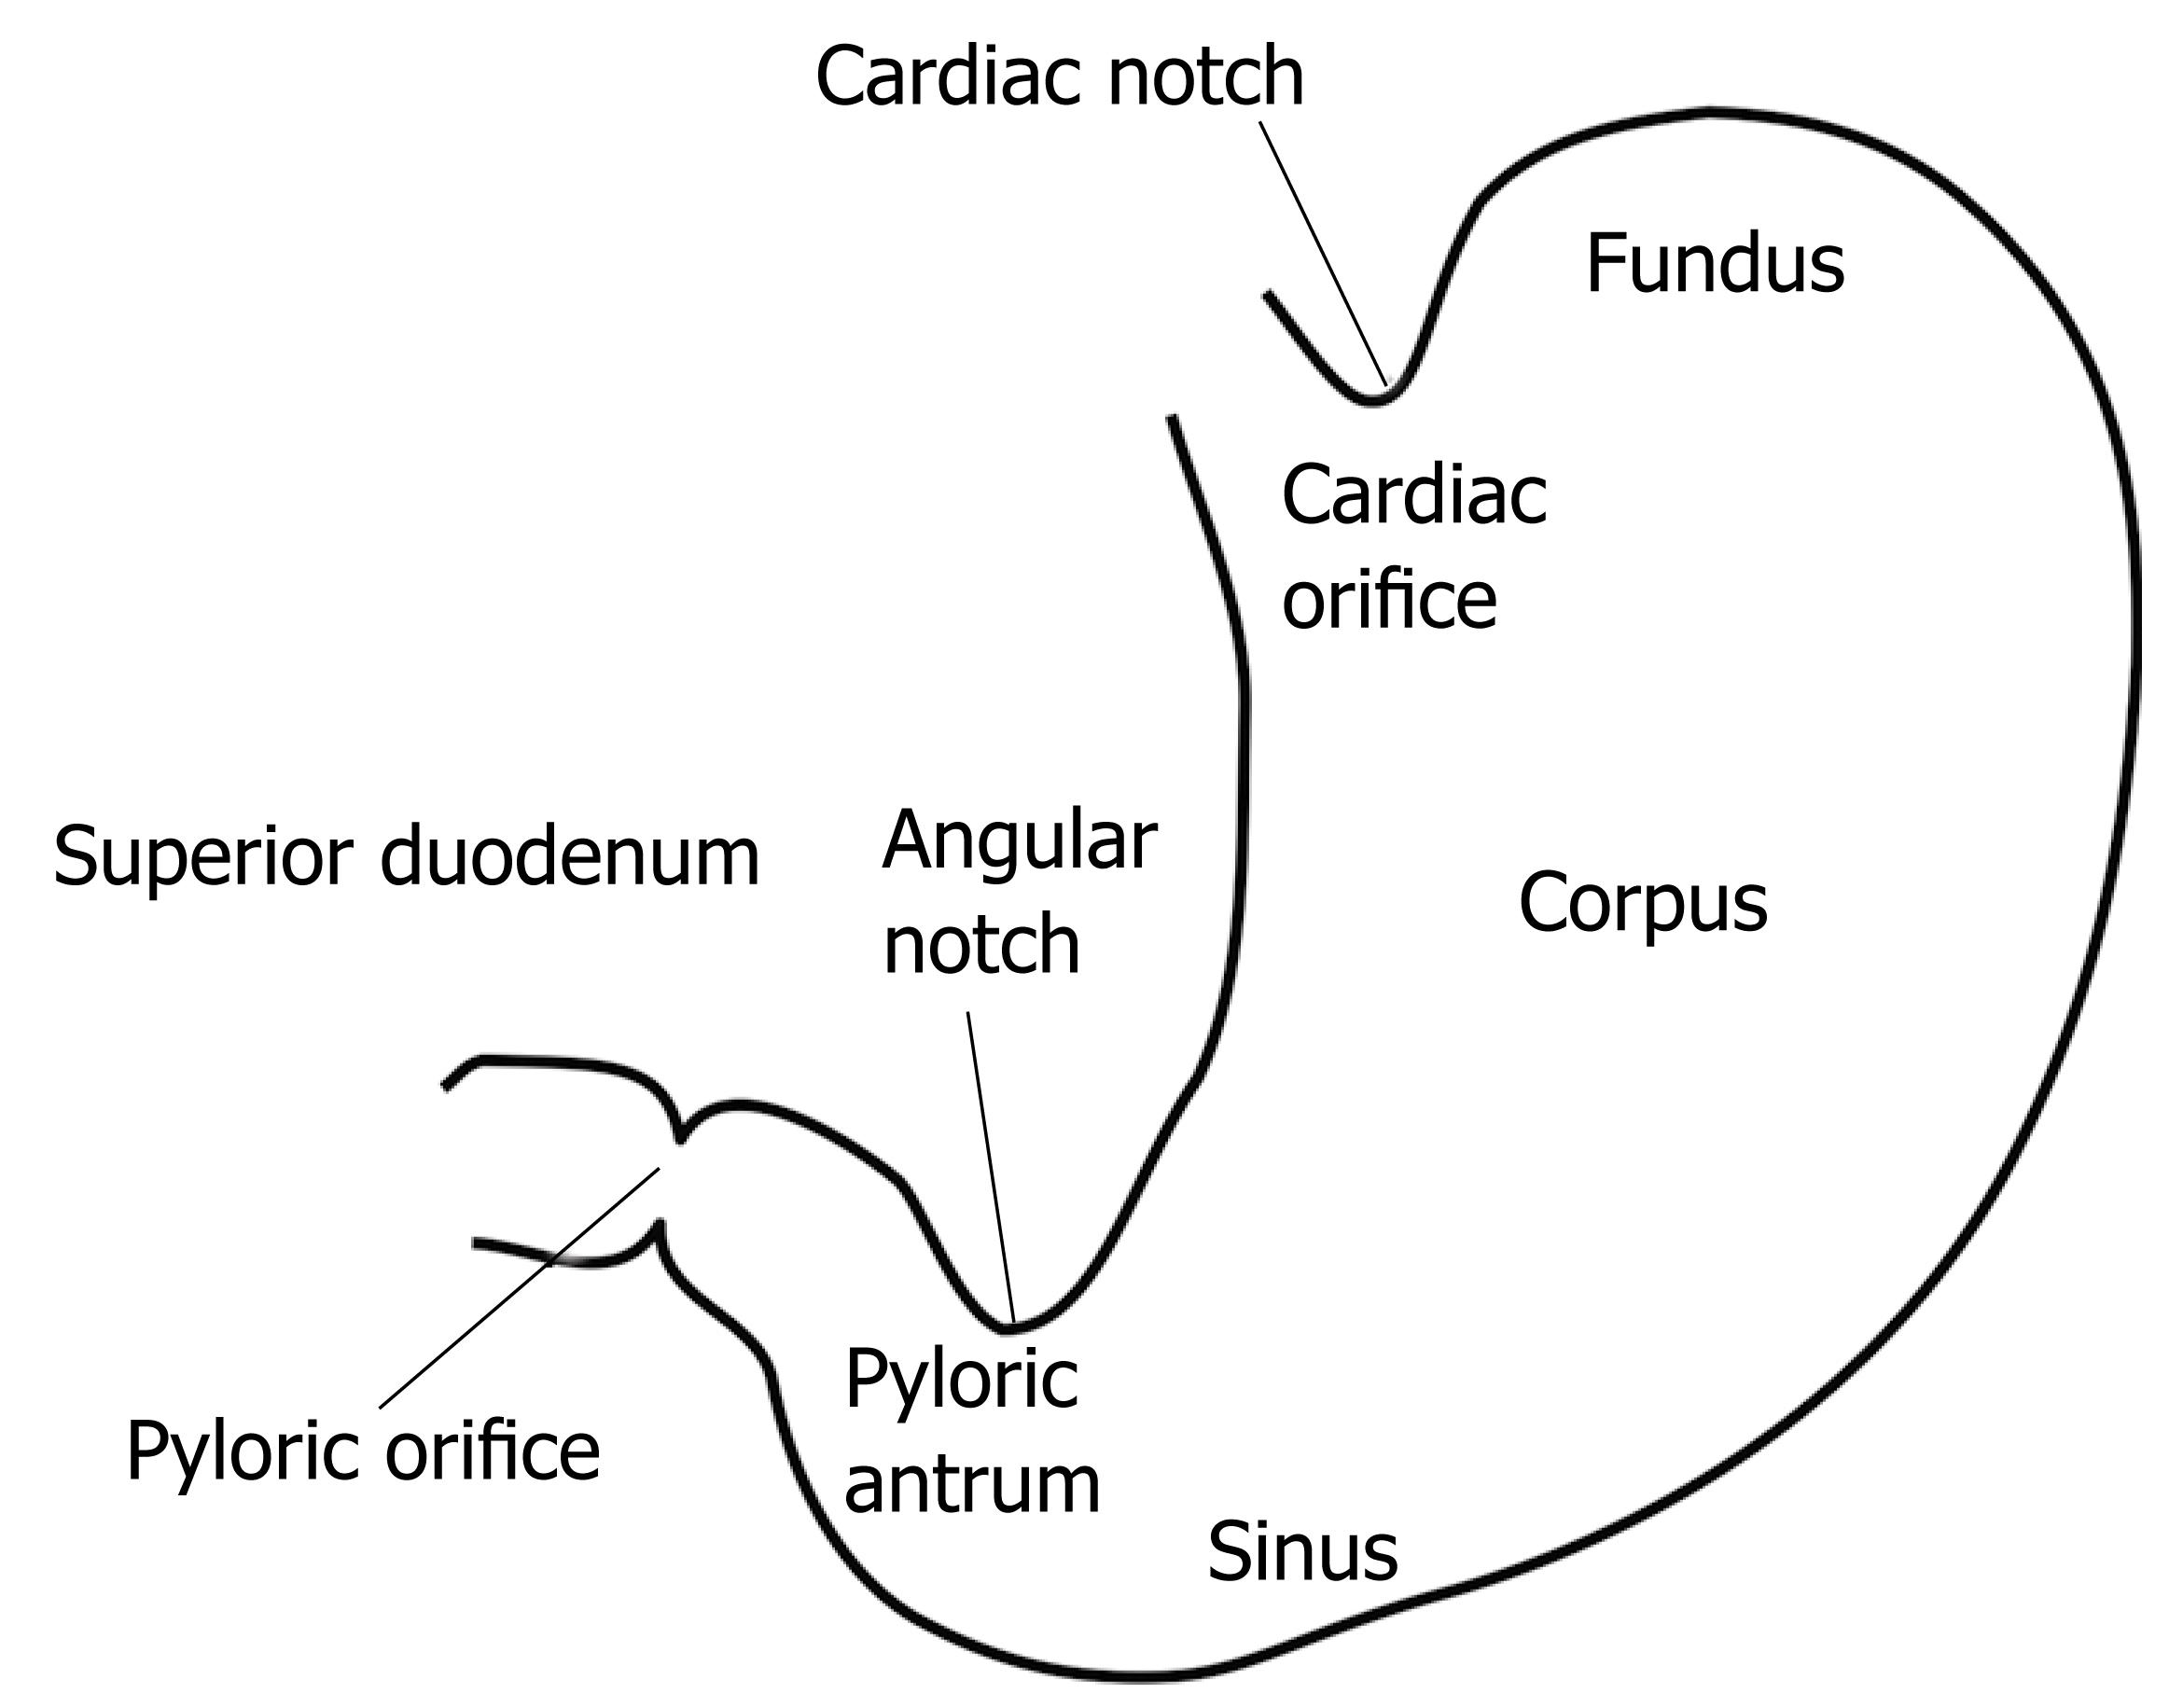
Figure 1 Normal physiological gastric outlet, pylorus, and superior duodenum.
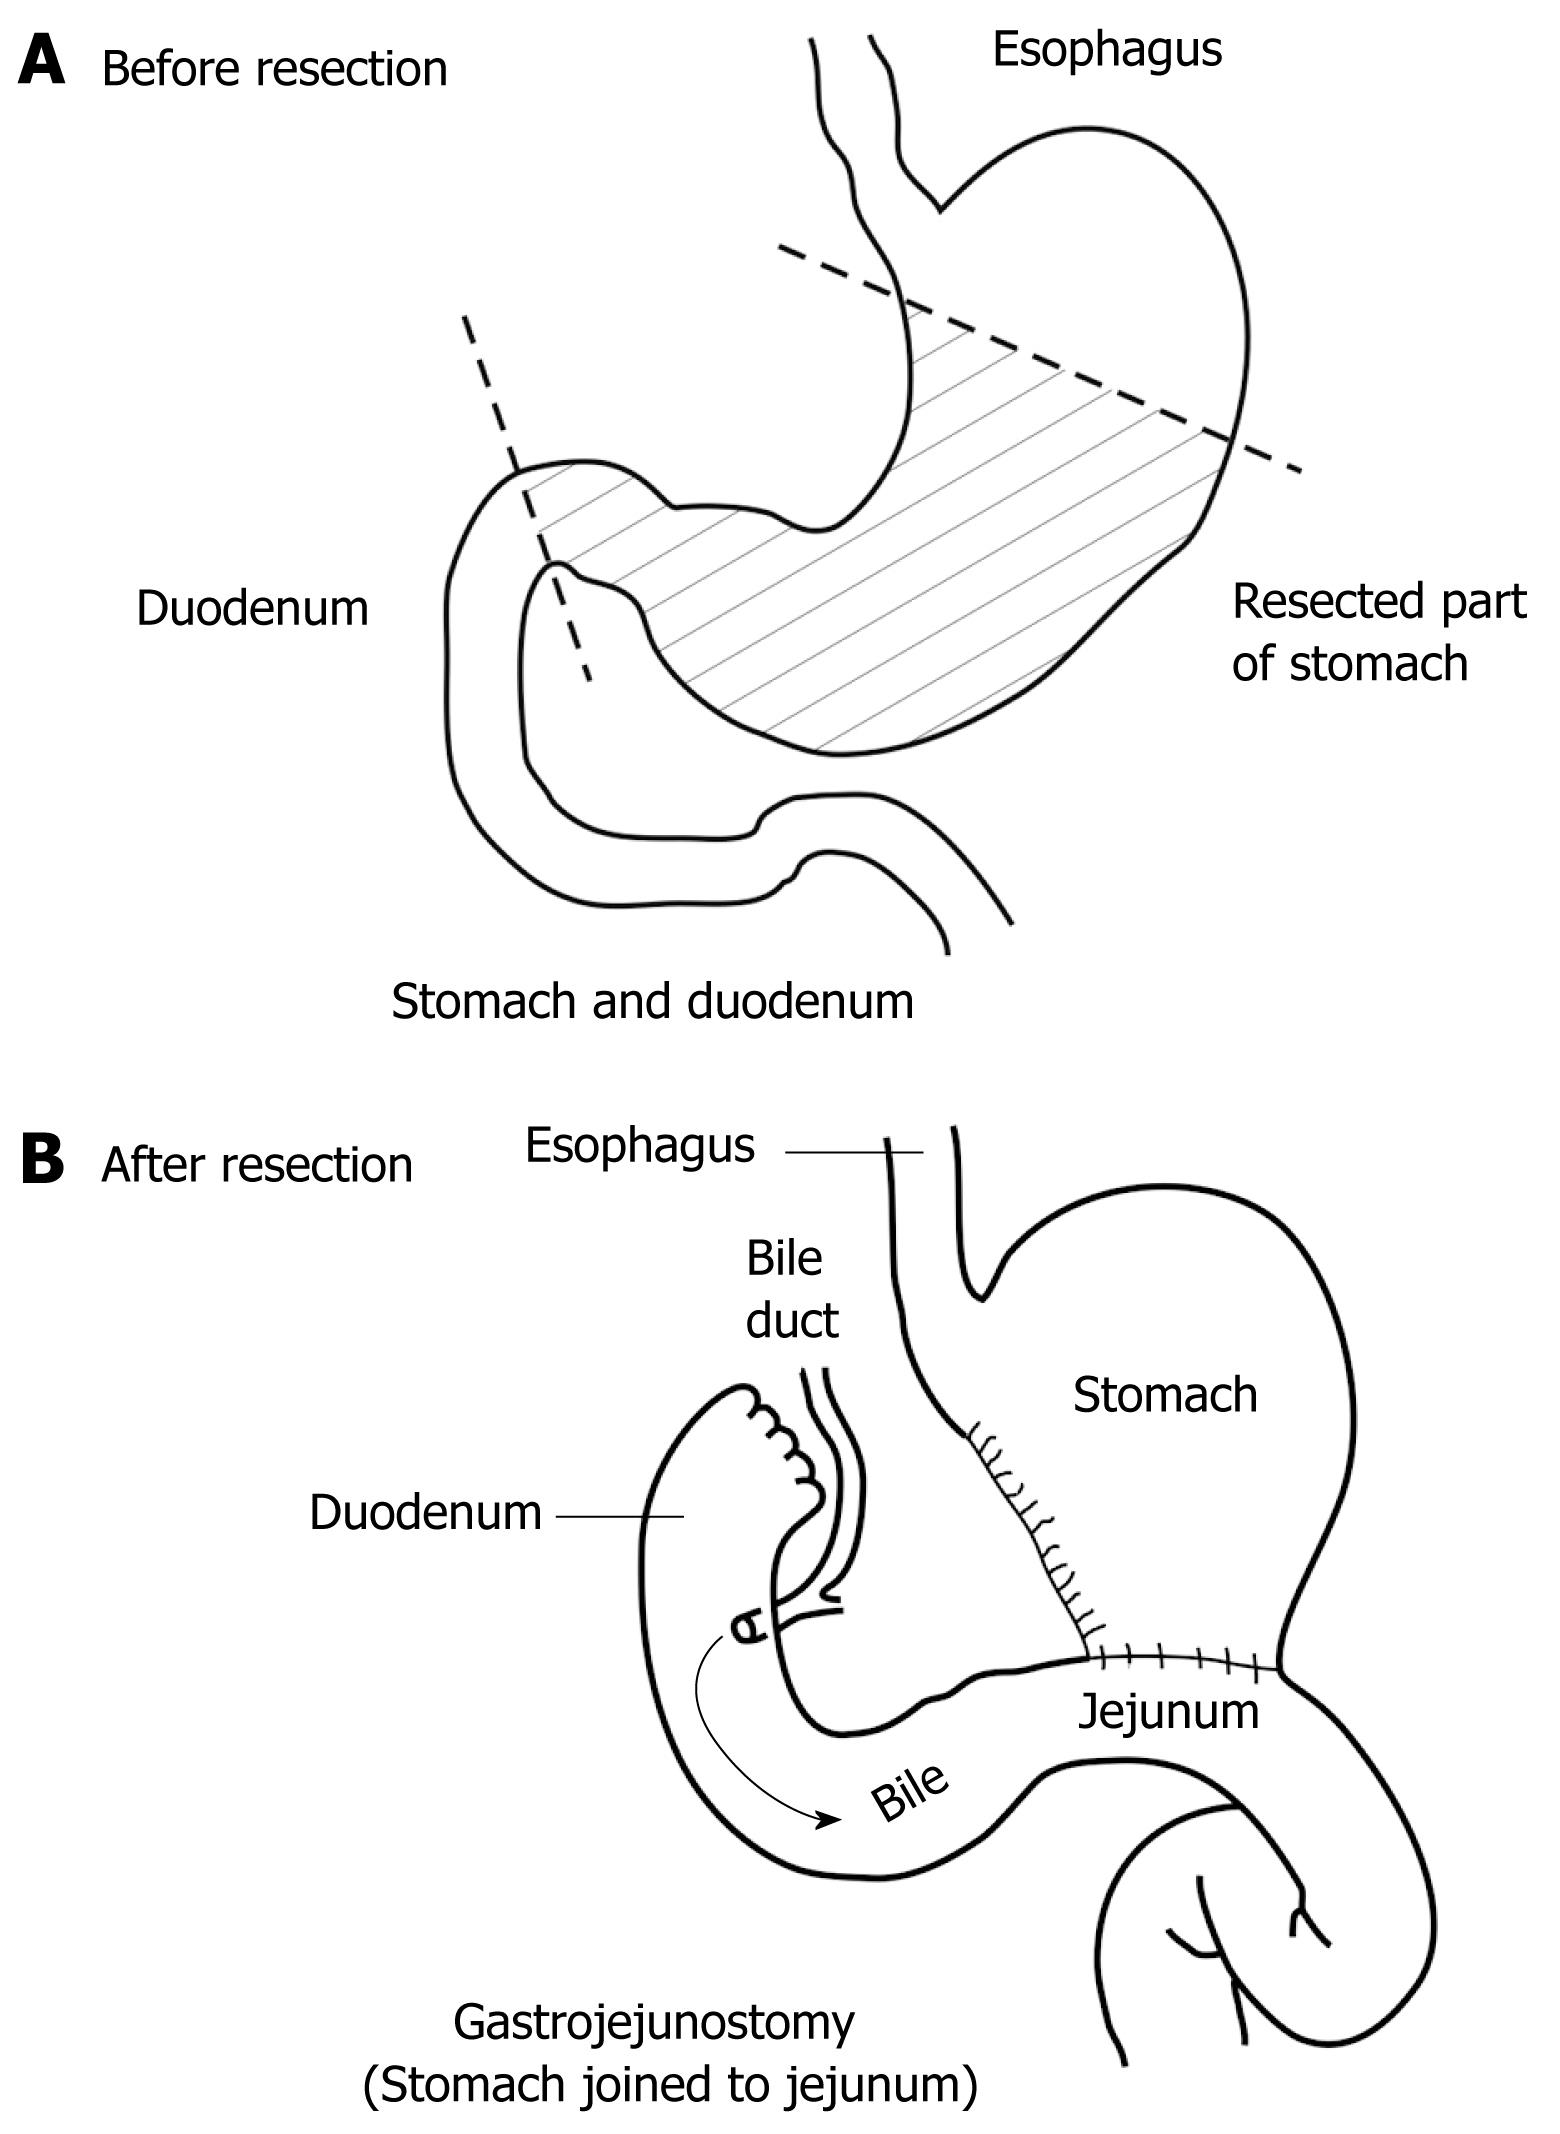
Figure 2 Schematic representation of reconstruction of gastrointestinal continuity after gastric resection.
A: Normal anatomy of gastroduodenal region with resection lines; B: Billroth II antiperistaltic anastomosis.
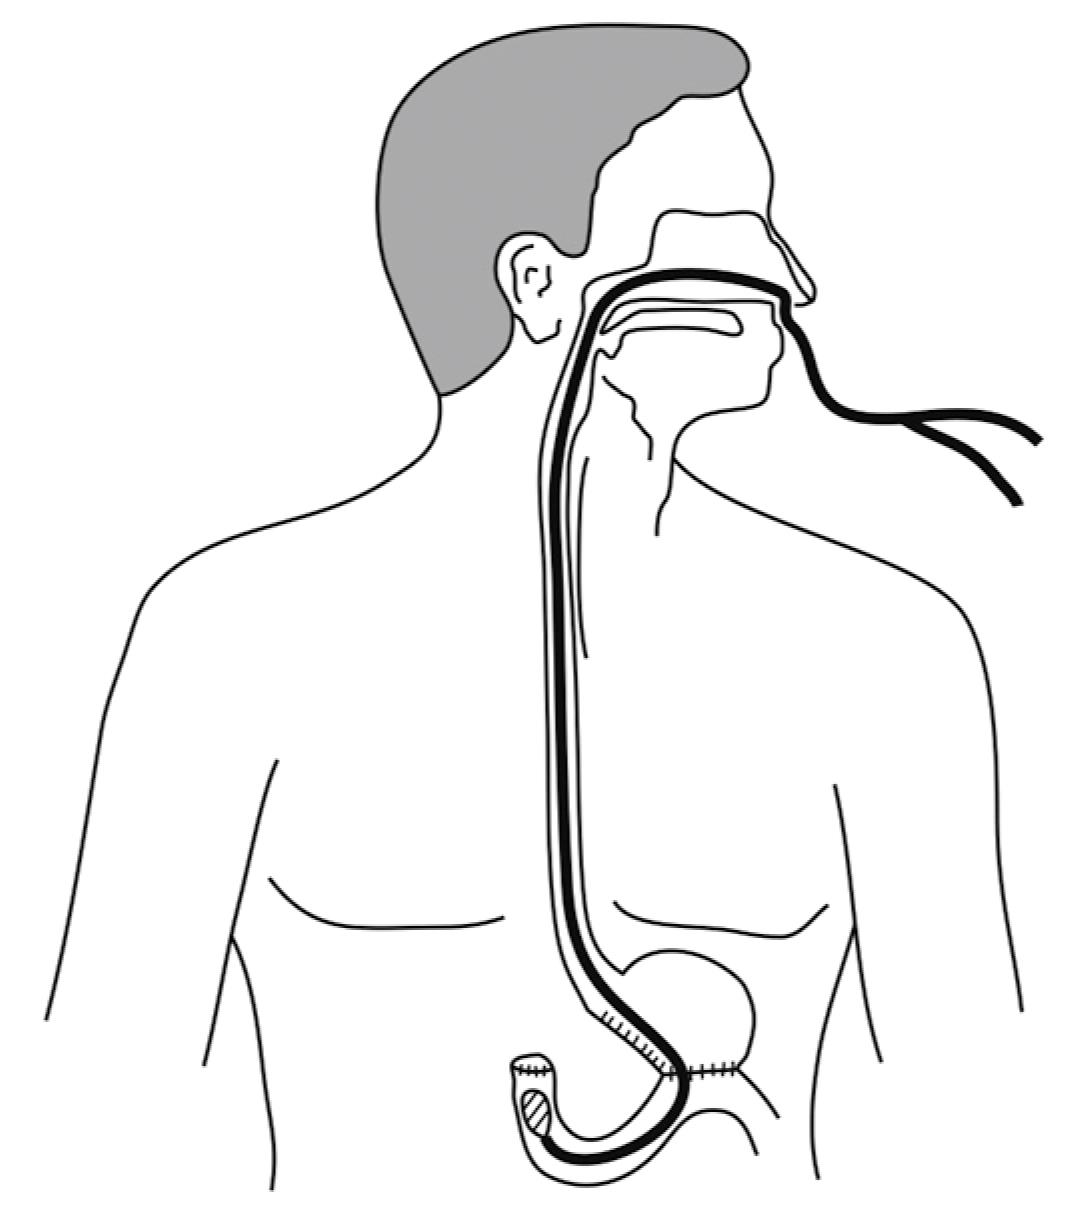
Figure 3 Schematic representation of the manometry equipment positioned in a patient during pressure measurement.
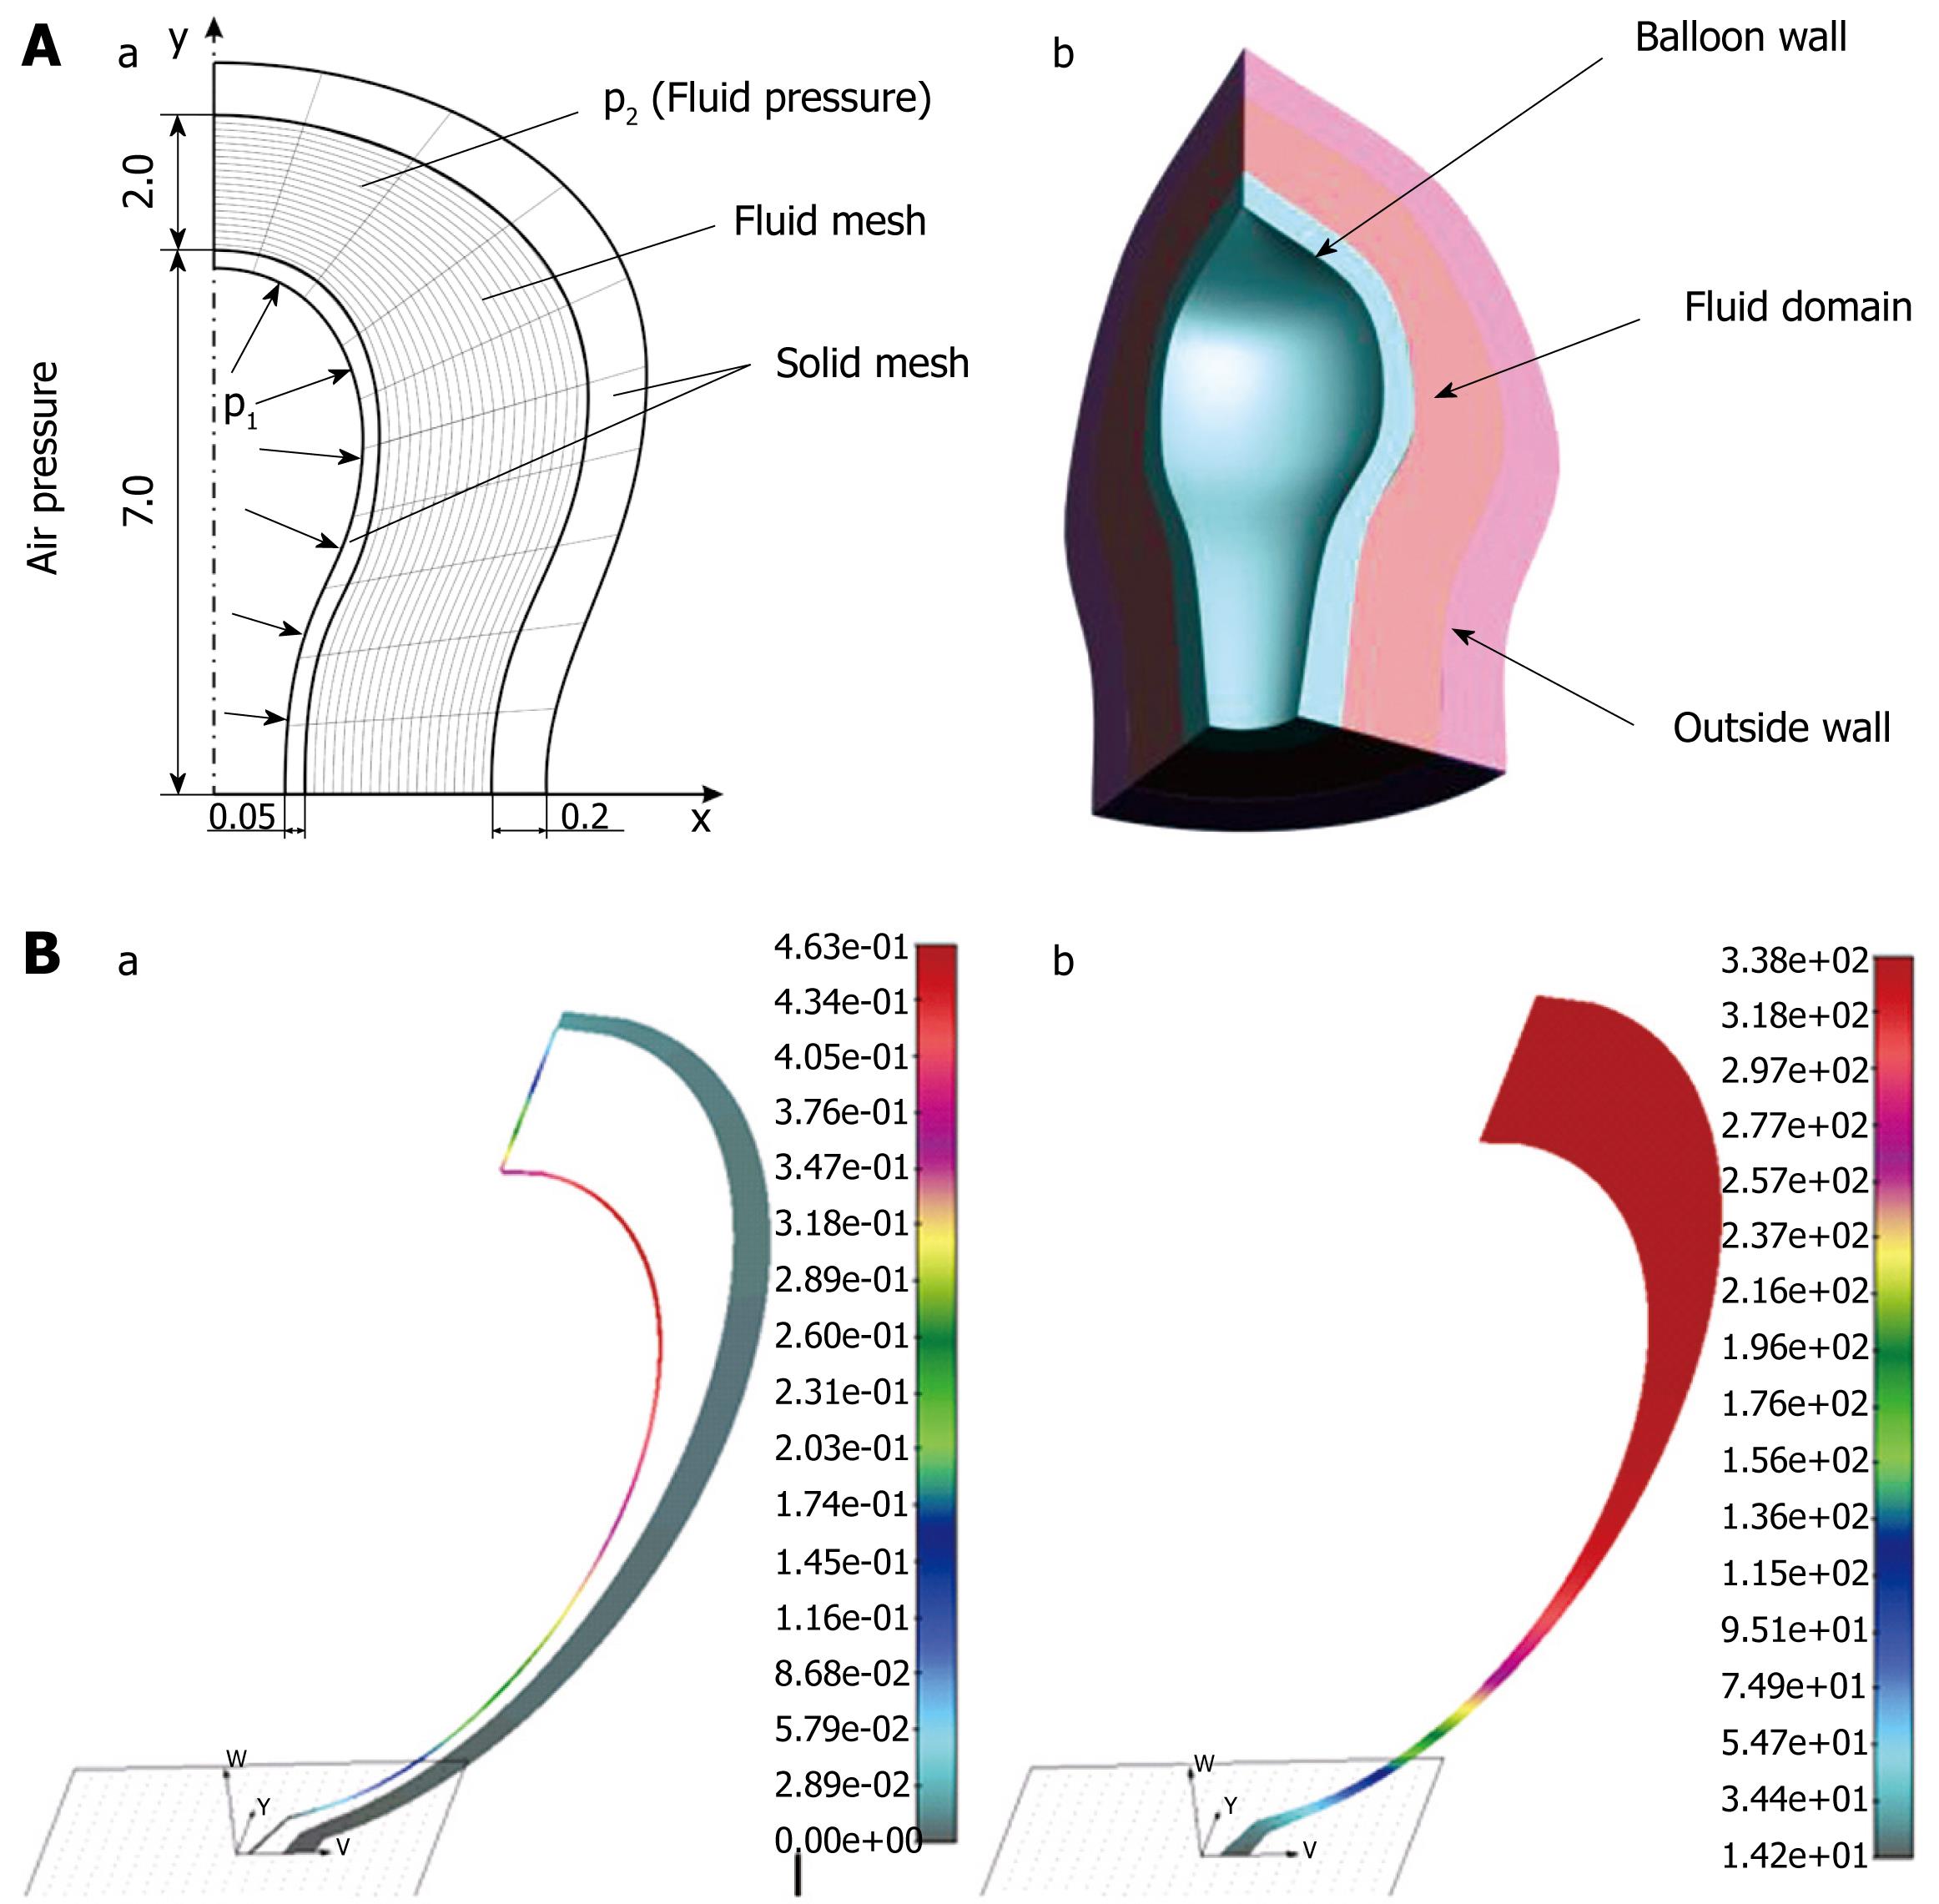
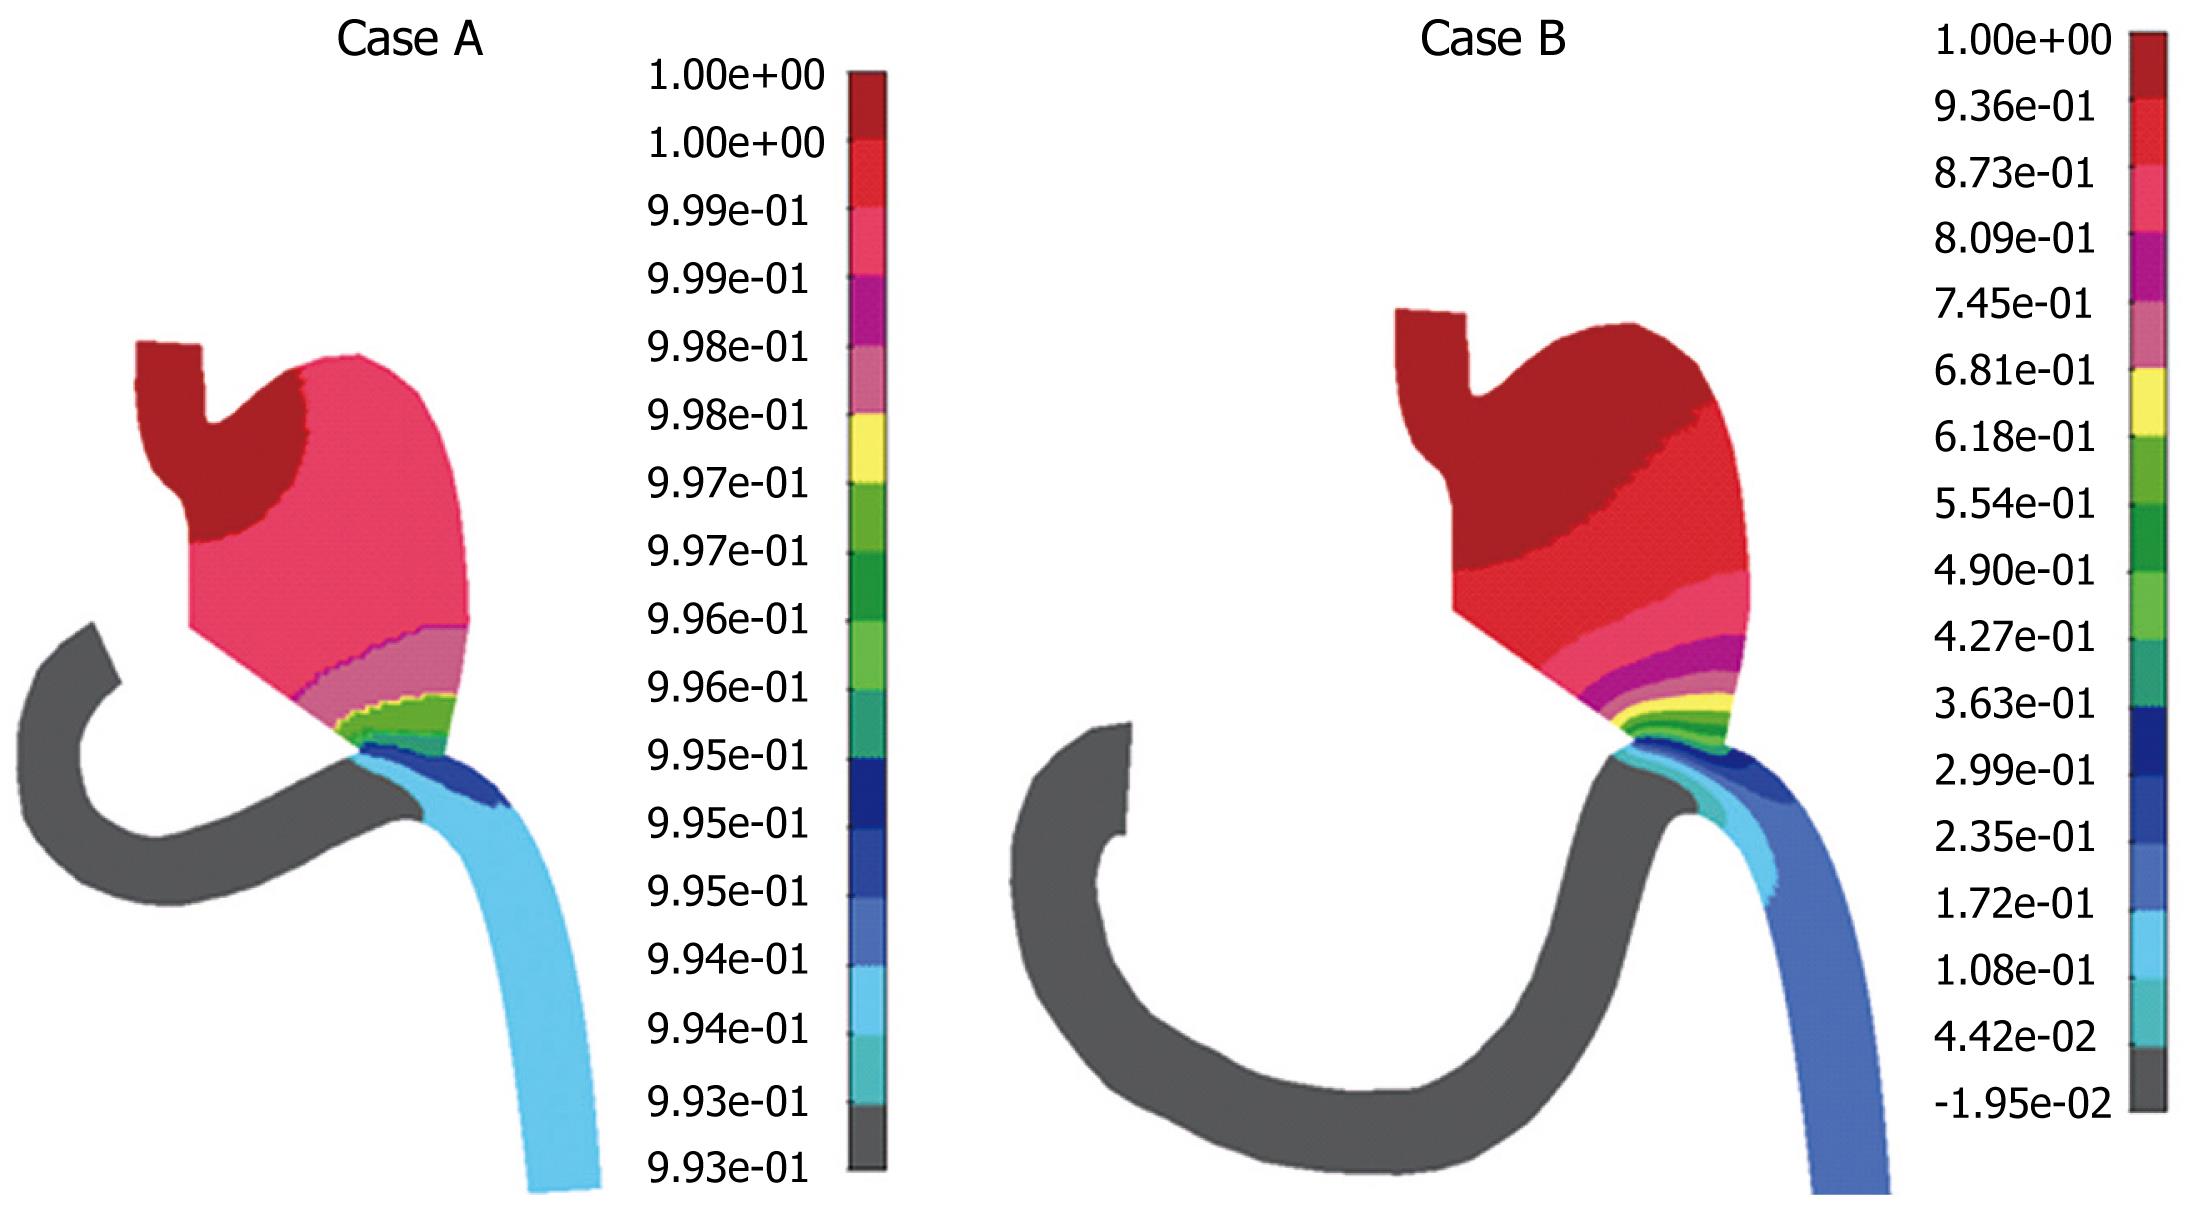
Figure 4 Computer simulation of pressure measurement inside duodenum bulb.
A: Schematic representation of the computational model of balloon pressure measurement inside the duodenum. Geometry of the model (a); 3D model view (b); B: Distribution of solid deformation (wall displacement) at the maximum pressure measurement (a); Fluid pressure distribution inside the duodenum (b).
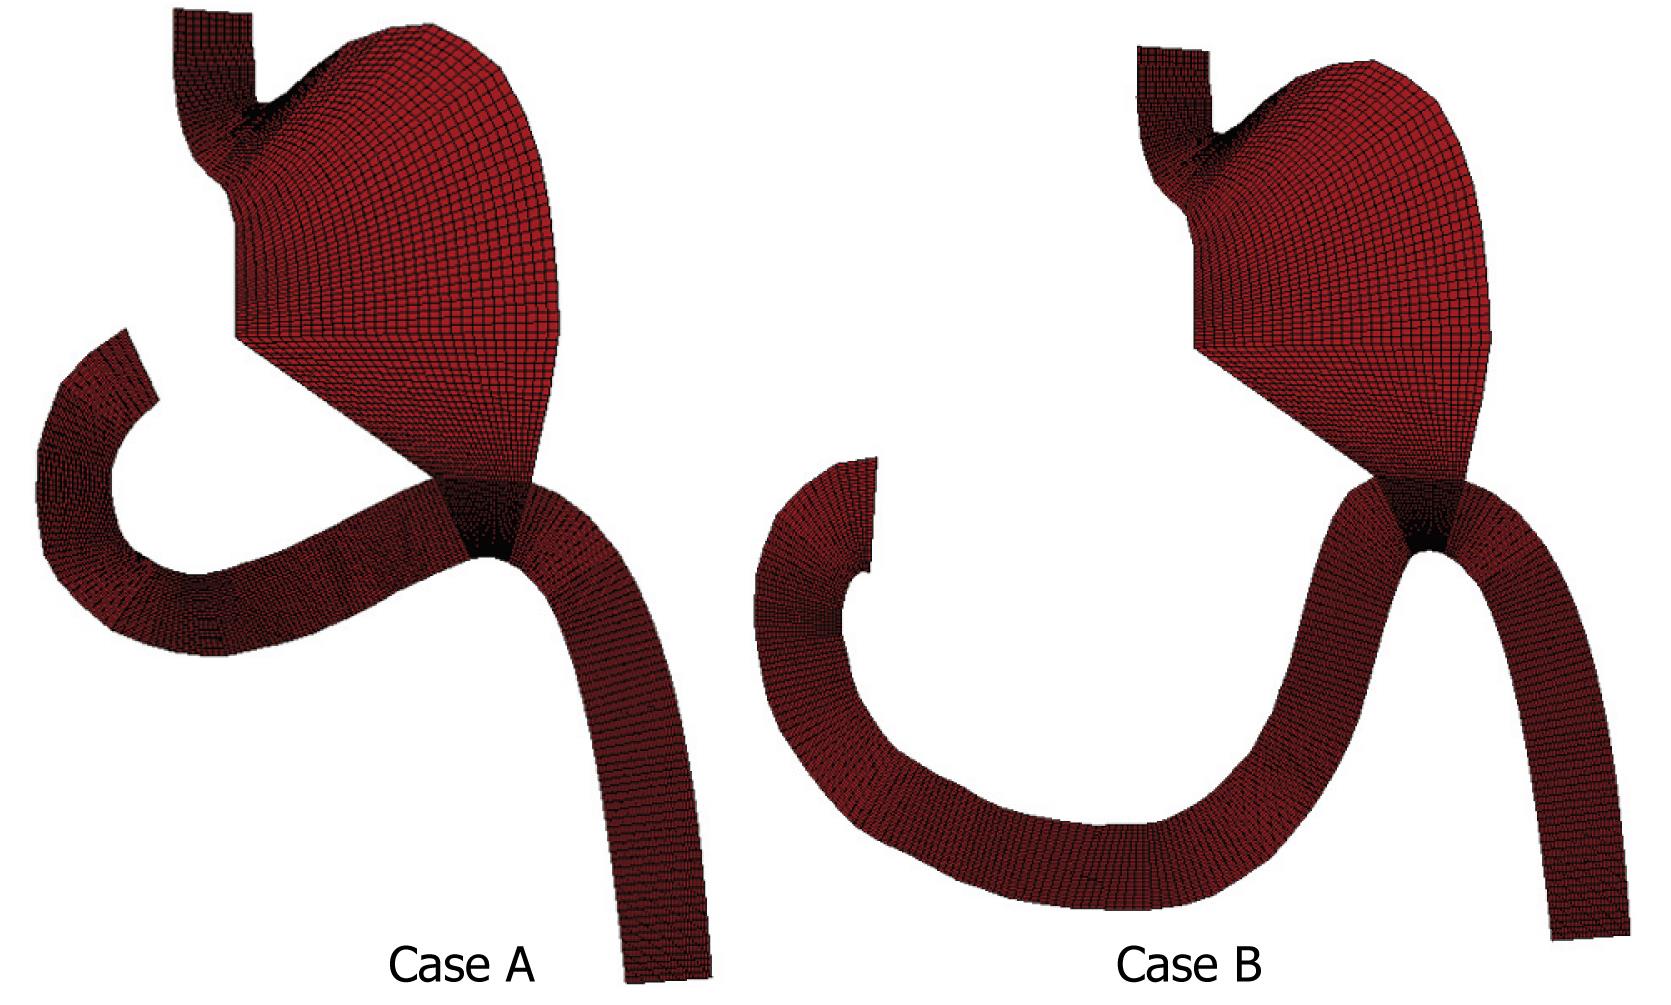
Figure 5 Geometry and finite element mesh of two selected cases.
Case A showed a straight duodenal part with shorter length. Case B had a much longer and curved duodenal section.
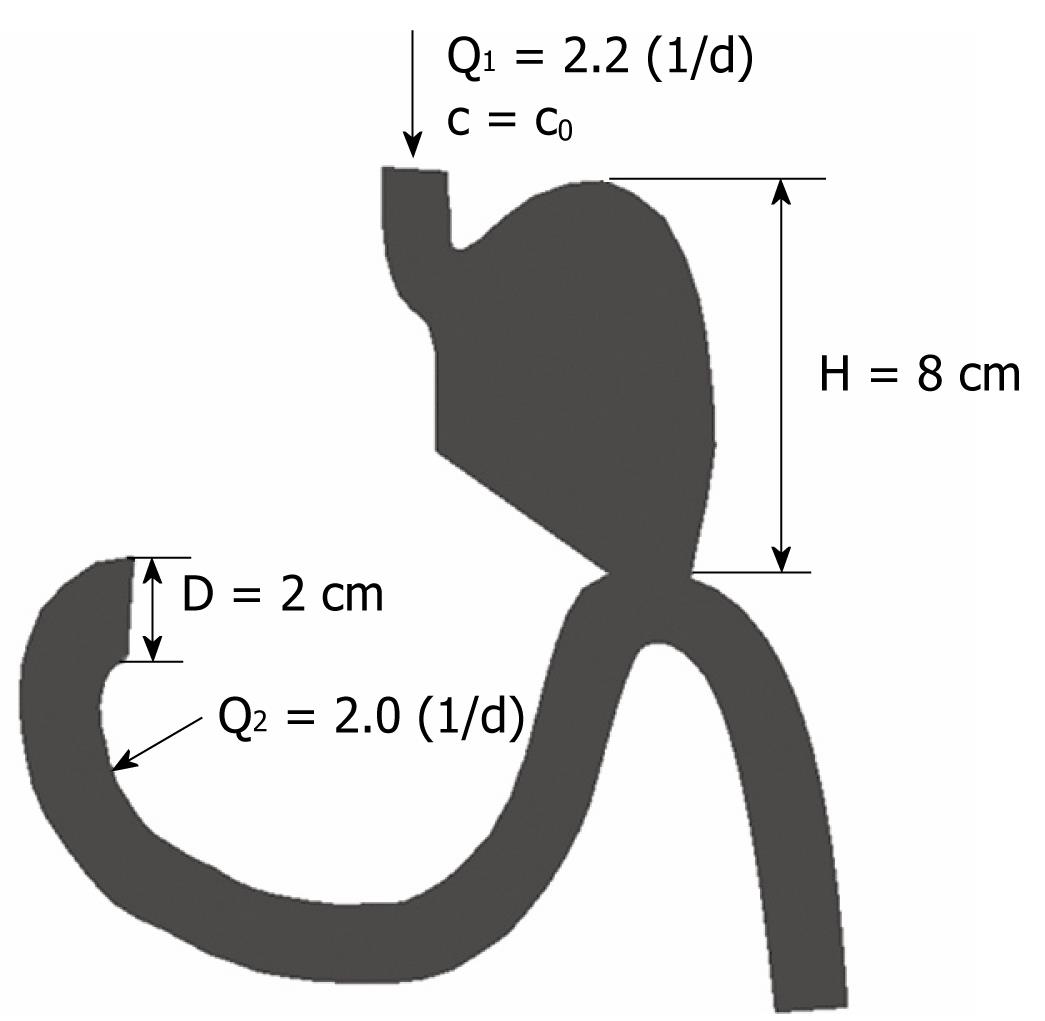
Figure 6 Geometry and boundary conditions for a Billroth II Hoffmeister-Finsterer operation.
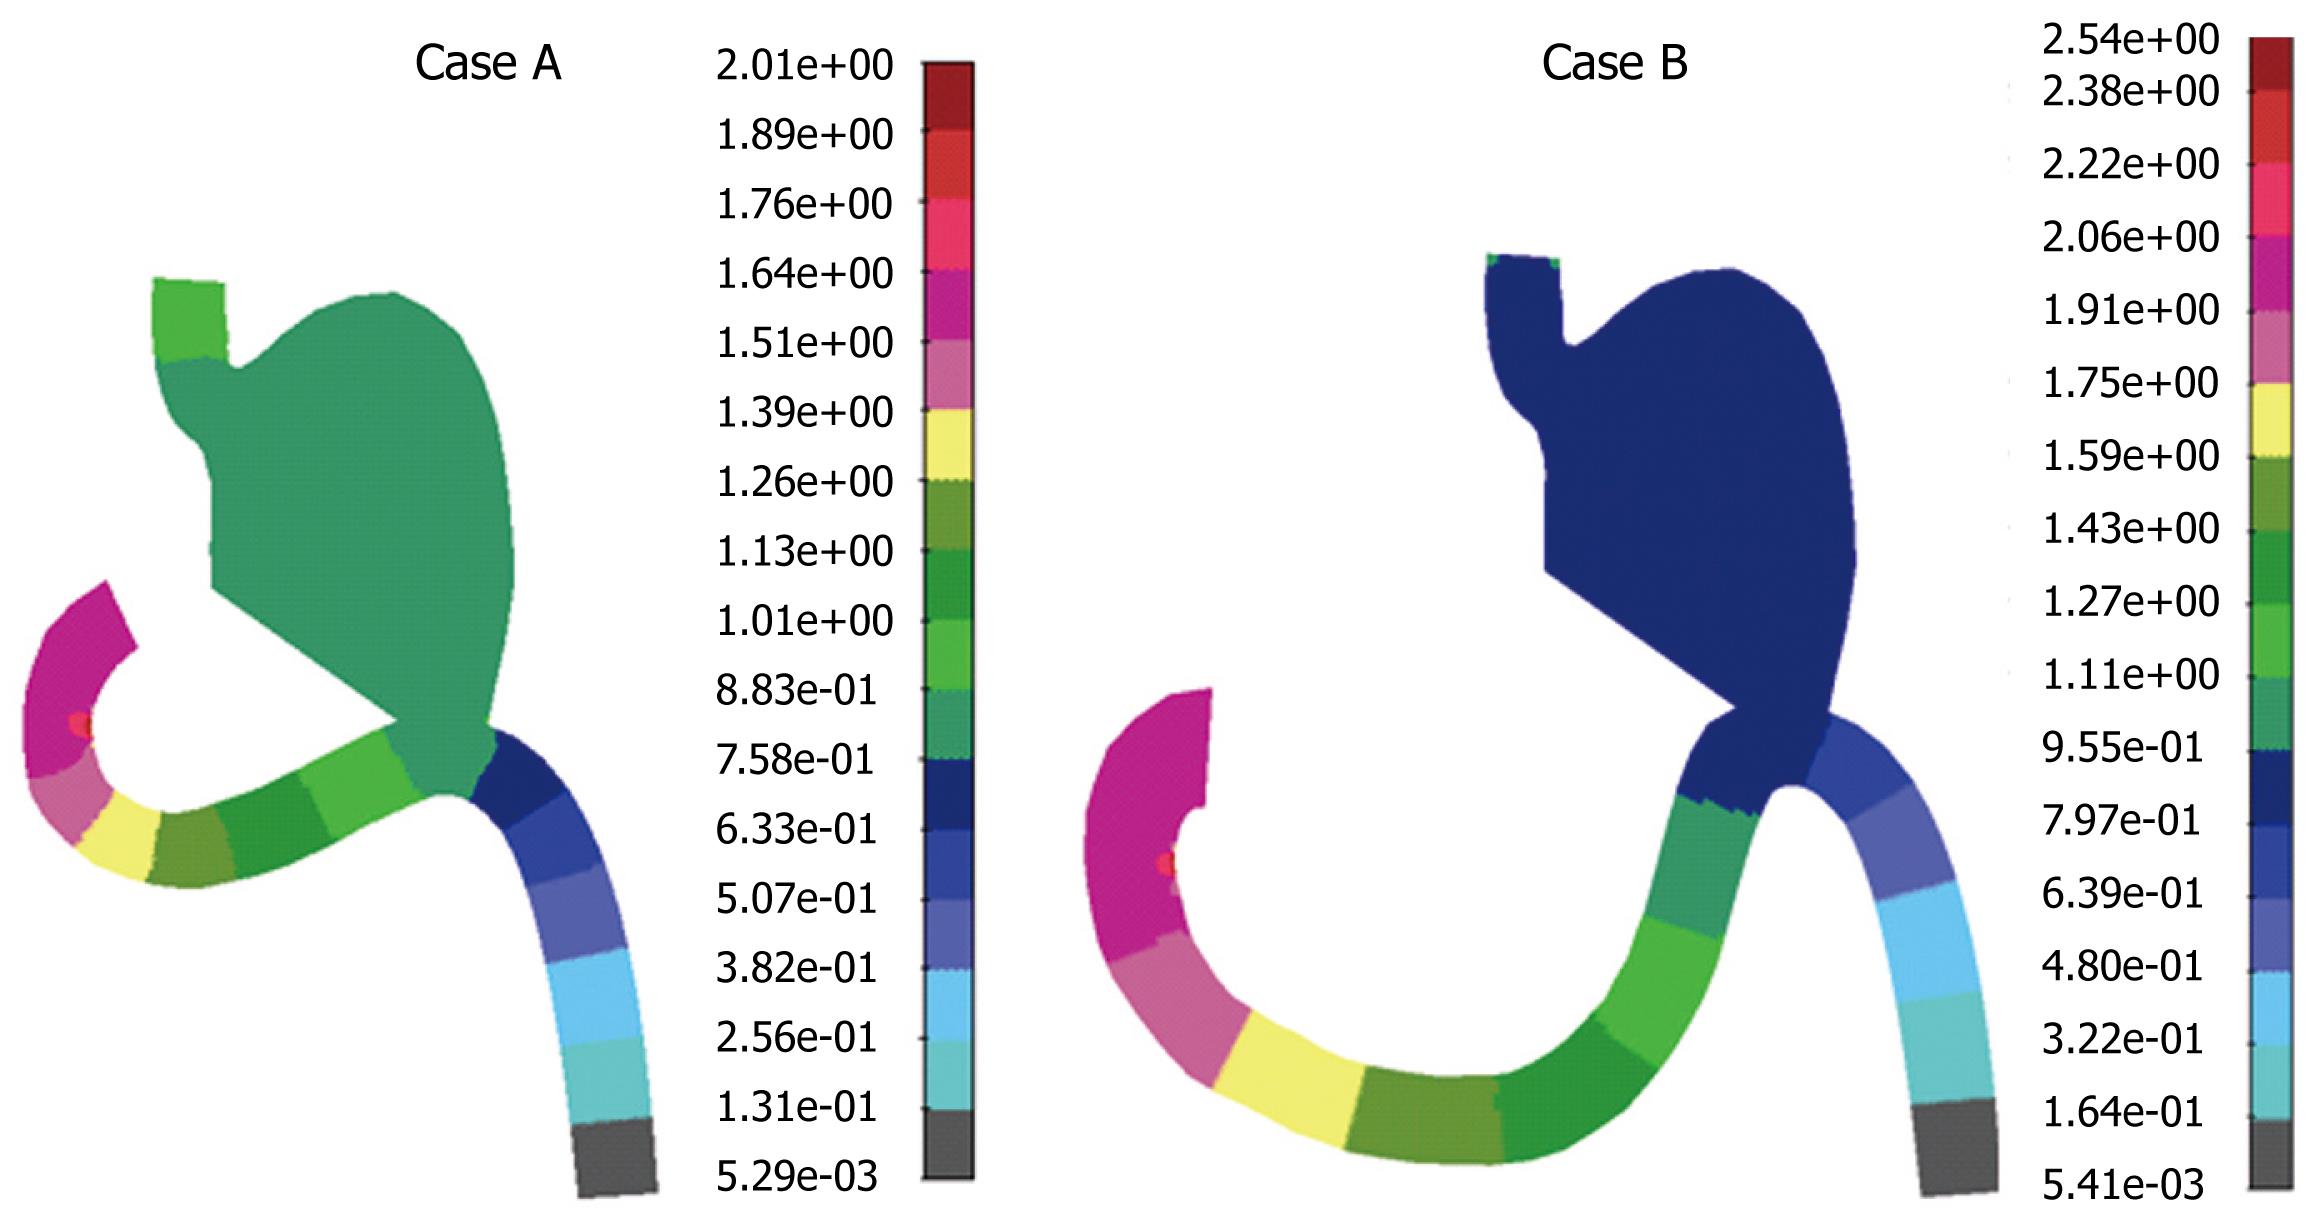
Figure 7 Velocity distribution for the steady state flow conditions [in (cm/s)].
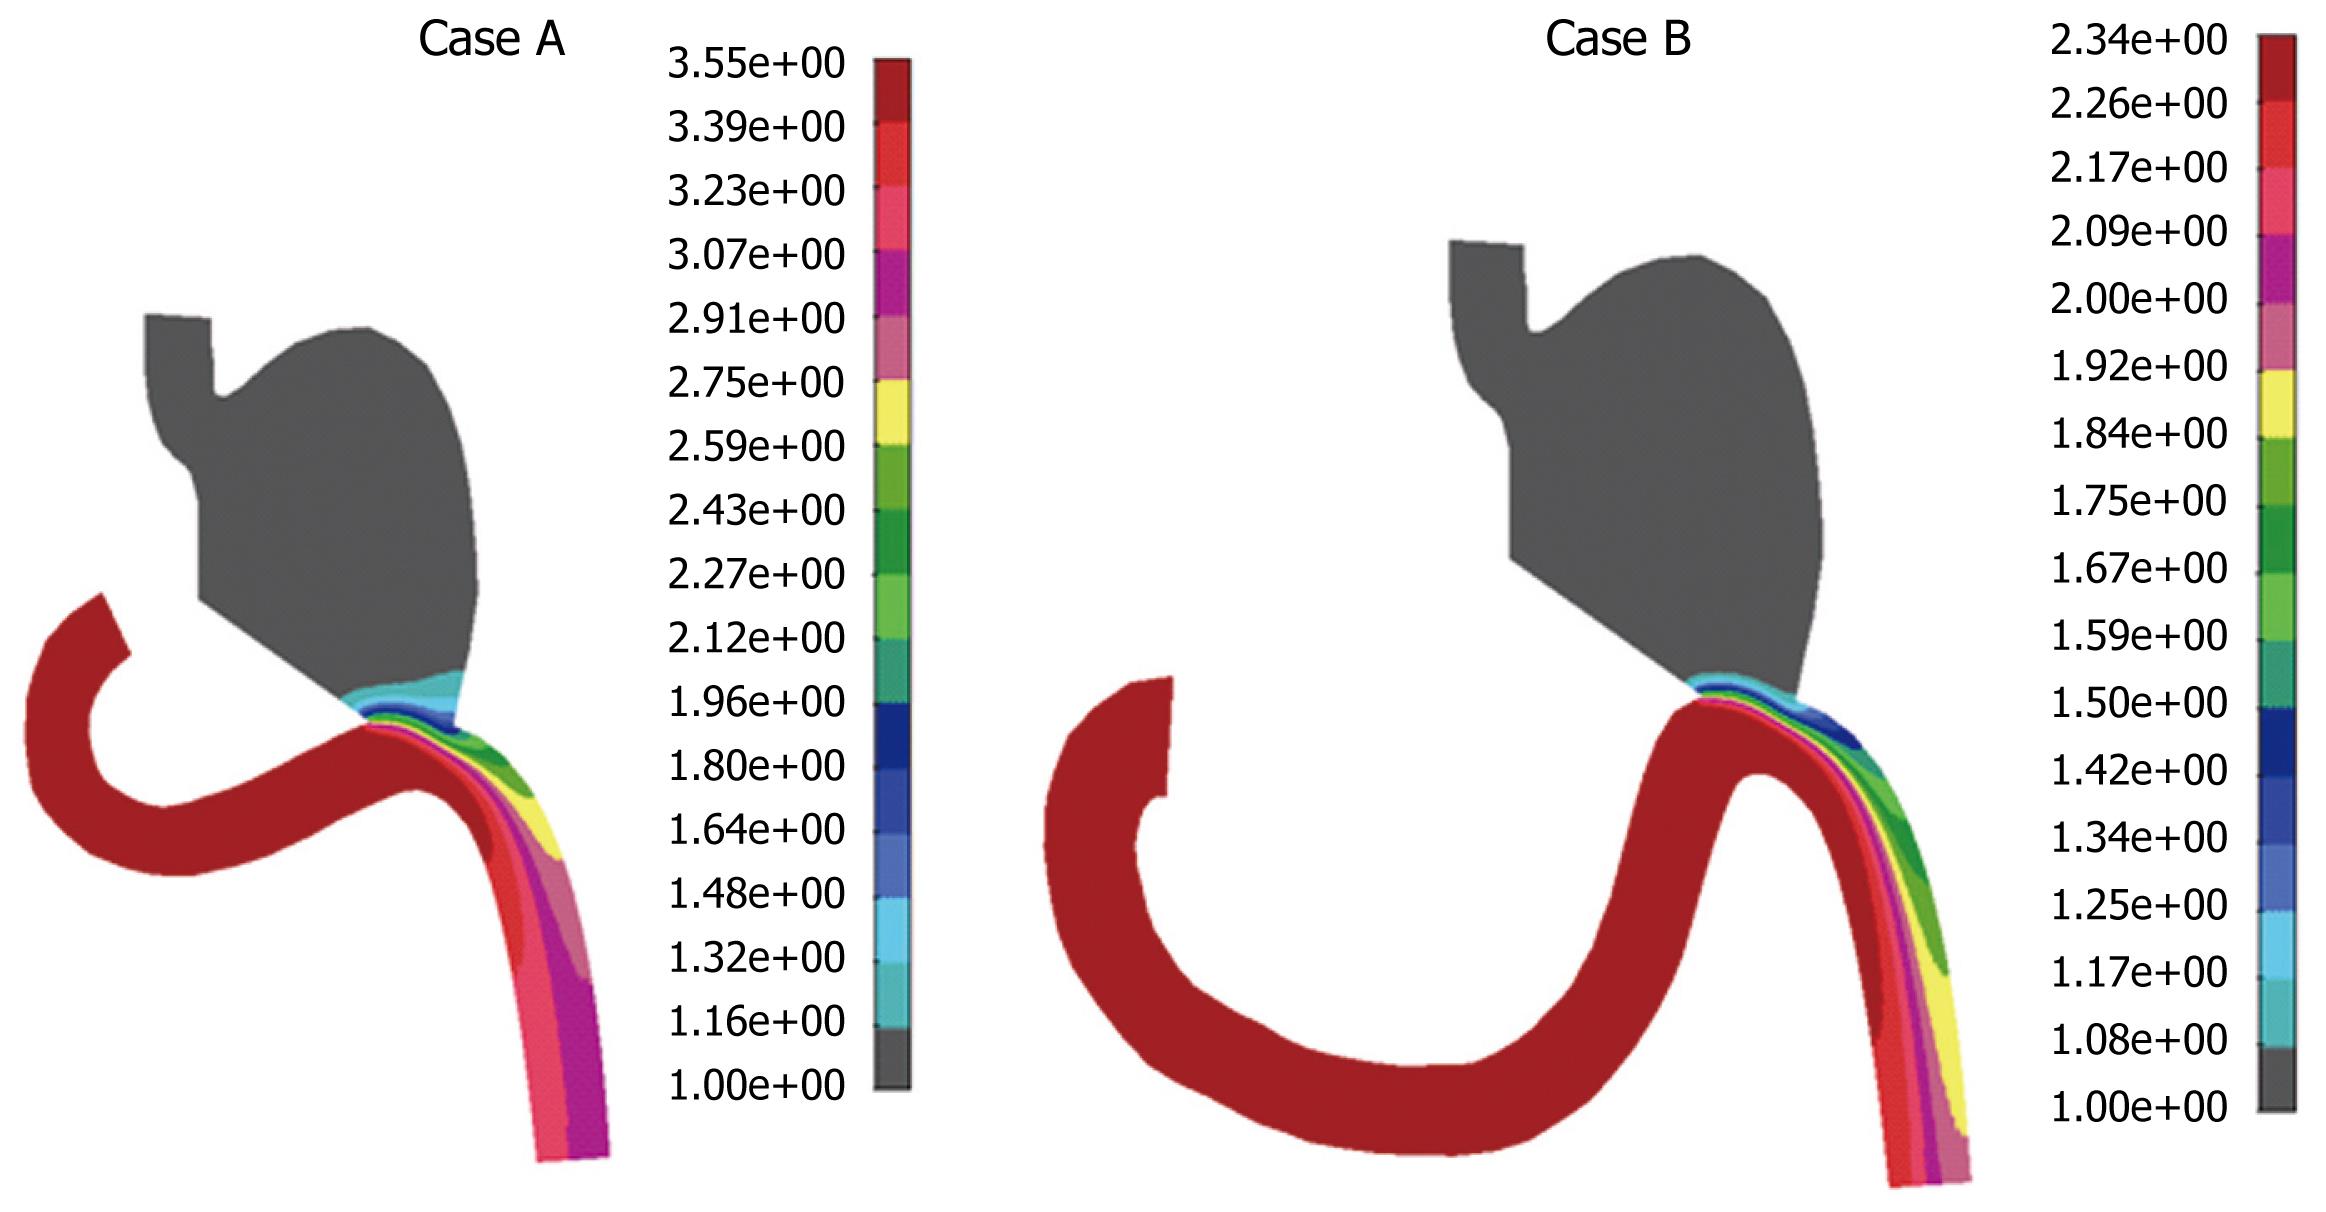
Figure 8 Pressure distribution for the steady state flow conditions [in (mmHg)].
Figure 9 Mass concentration [in (g/cm3)] distribution for the diffusion coefficient D = 2.
0e-3 cm2/s.
Figure 10 Mass concentration [in (g/cm3)] distribution for the diffusion coefficient D = 8.
0e-3 cm2/s.
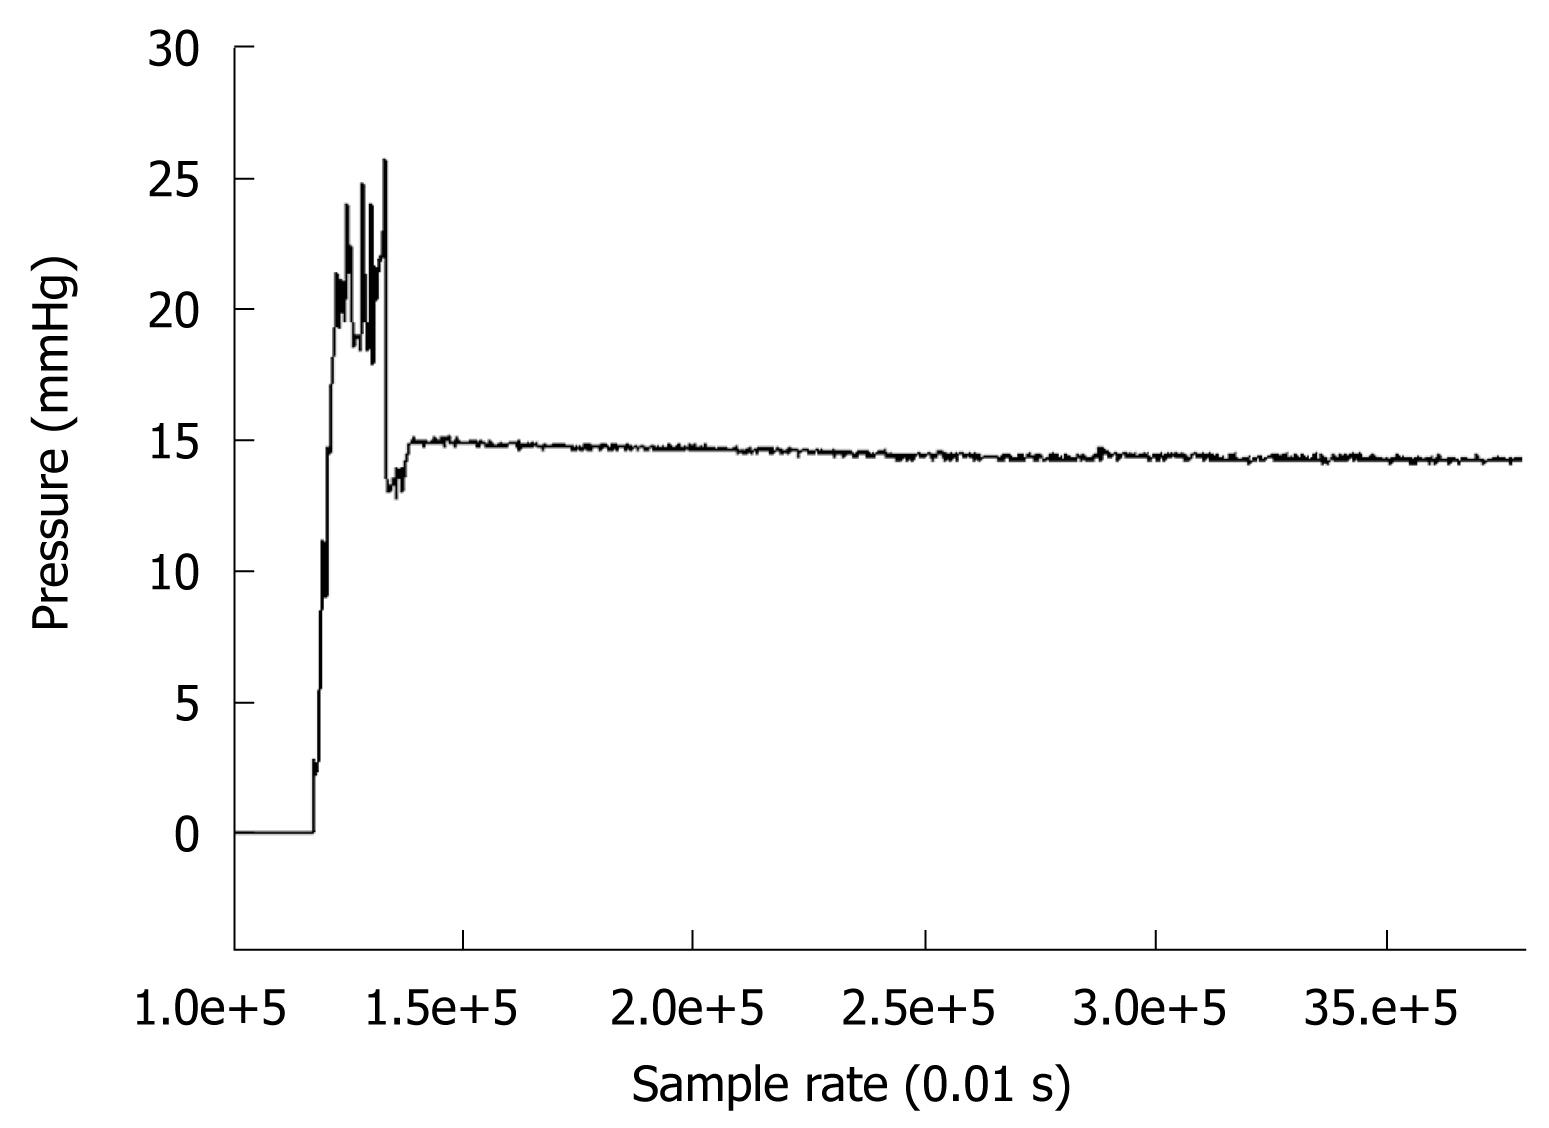
Figure 11 Pressure measurement of Miller-Abbott (MA) tube and connecting catheter in the duodenum at 3 d after gastric resection.
- Citation: Filipovic N, Cvetkovic A, Isailovic V, Matovic Z, Rosic M, Kojic M. Computer simulation of flow and mixing at the duodenal stump after gastric resection. World J Gastroenterol 2009; 15(16): 1990-1998
- URL: https://www.wjgnet.com/1007-9327/full/v15/i16/1990.htm
- DOI: https://dx.doi.org/10.3748/wjg.15.1990


