Copyright
©2009 The WJG Press and Baishideng.
World J Gastroenterol. Apr 28, 2009; 15(16): 1966-1972
Published online Apr 28, 2009. doi: 10.3748/wjg.15.1966
Published online Apr 28, 2009. doi: 10.3748/wjg.15.1966
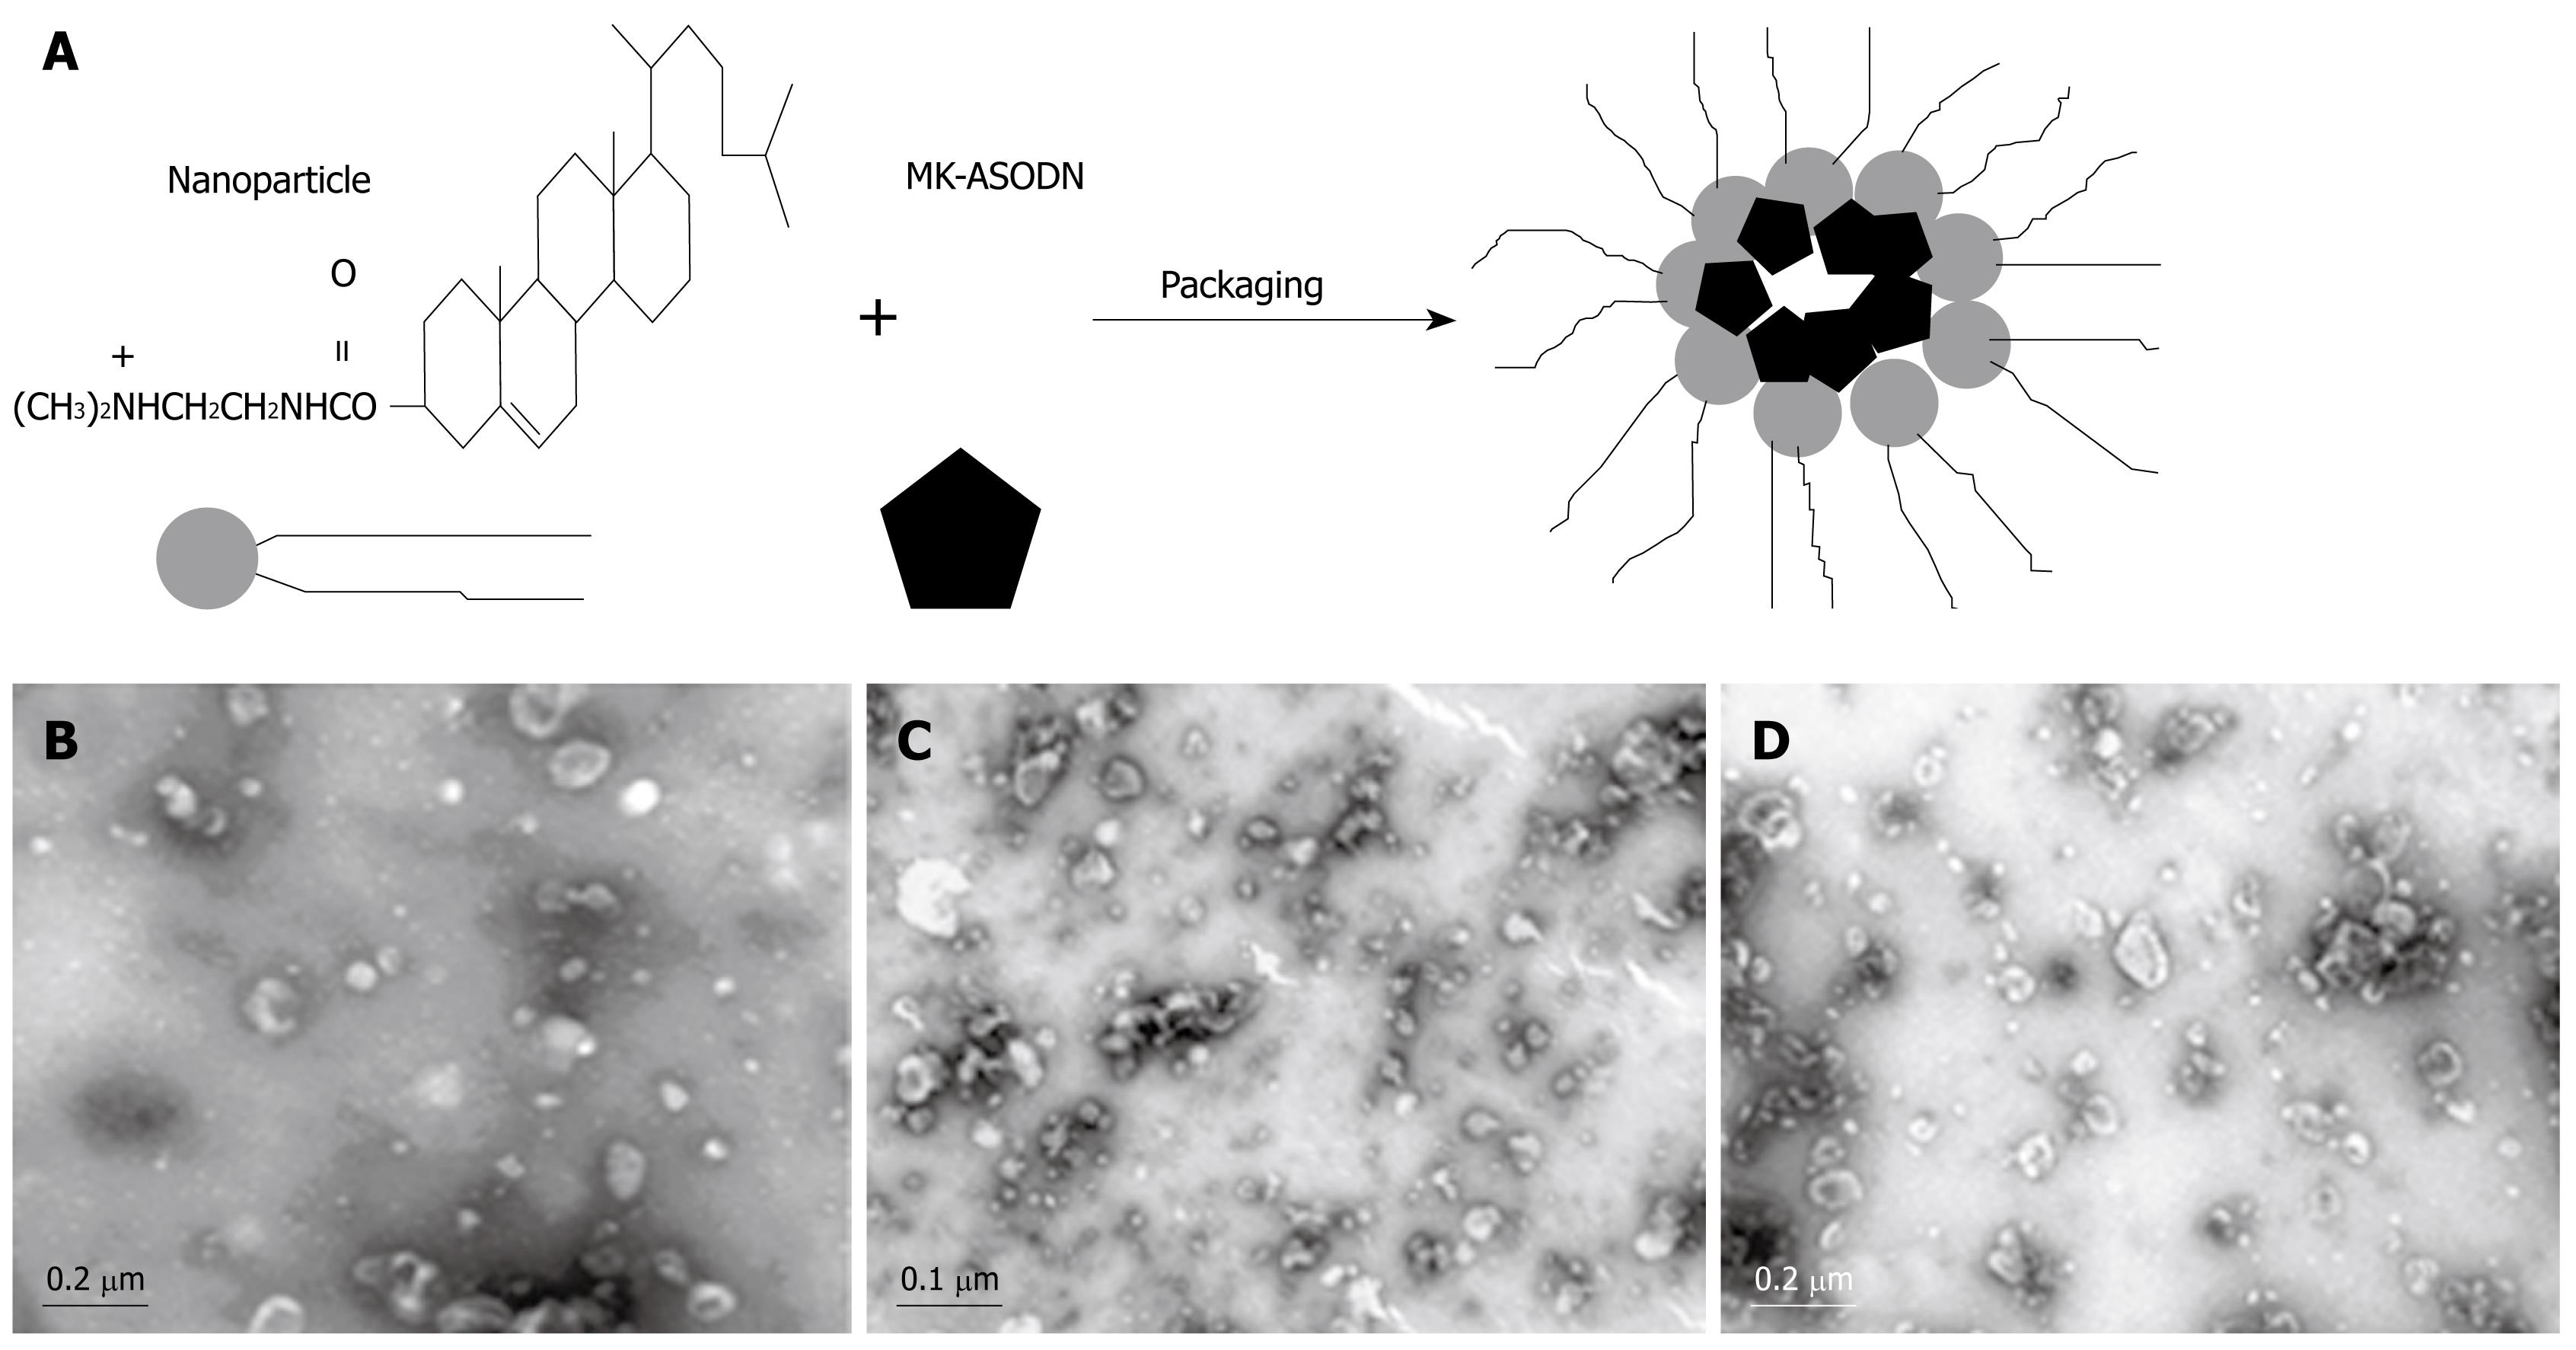
Figure 1 Nano-assembly of MK-ASODNs and nanoliposomes and characterization of NANO-ASODNs.
A: Schematic illustration of the self-assembly of MK-ASODN and nanoliposomes; B: TEM image of the empty nanoliposomes stained with 1% uranyl acetate; C, D: TEM image of the NANO-ASODNs.
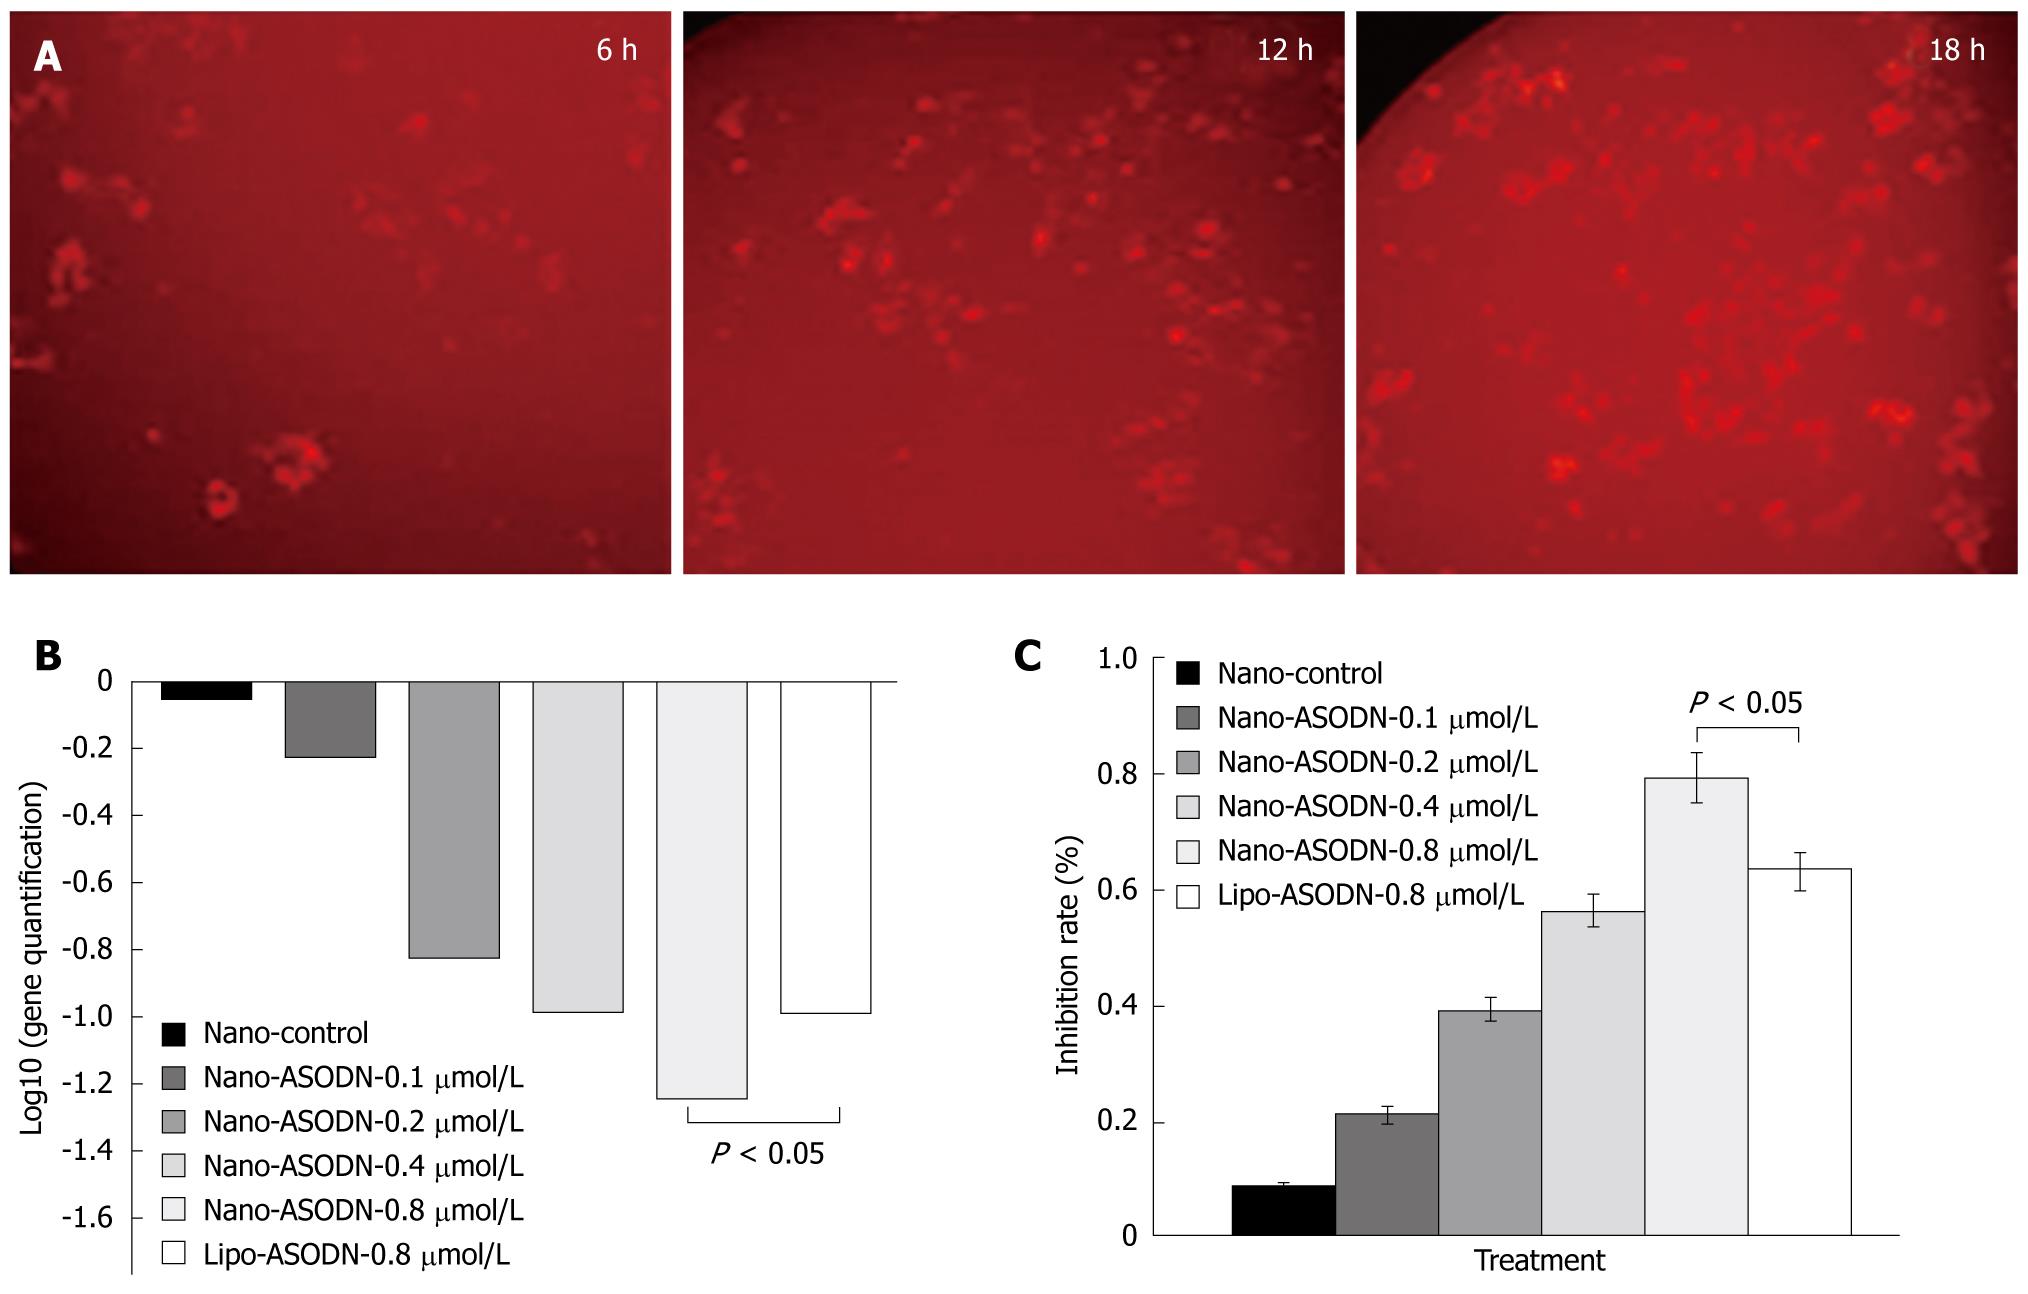
Figure 2 Transduction and function of NANO-ASODNs in vitro.
A: 0.2 &mgr;mol/L FAM-conjugated NANO-ASODNs transduced into HepG2 cells. The results were observed under a confocal microscope at indicted times of 6, 12 and 18 h; B: NANO-ASODNs down-regulated expression of MK mRNA; C: The proliferation of HepG2 cells was significantly inhibited by NANO-ASODNs.
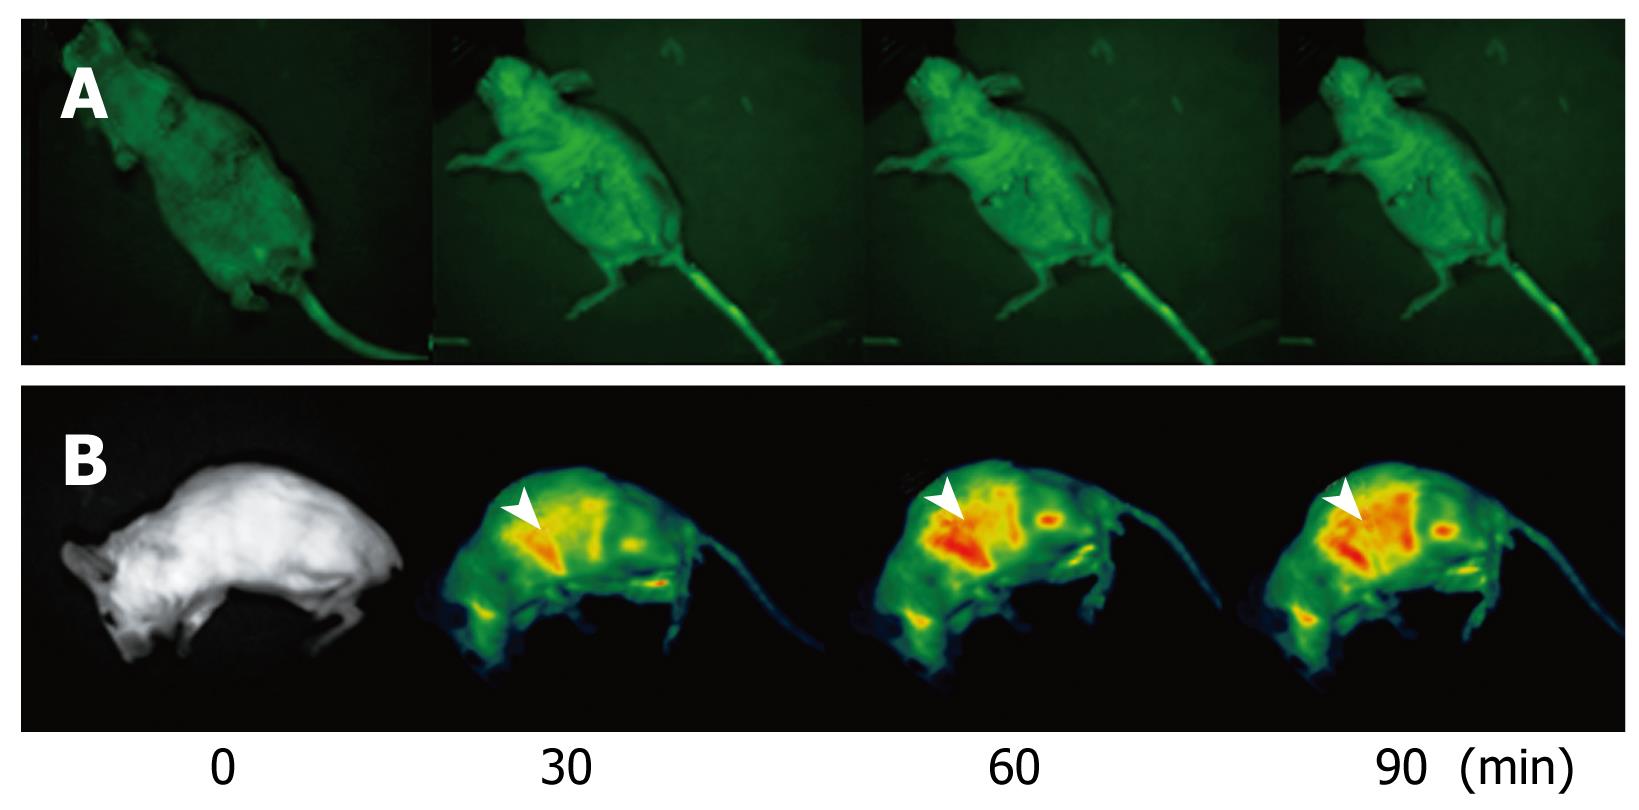
Figure 3 NANO-ASODNs target the liver.
The kinetic results of the NANO-ASODNs were observed through in vivo imaging systems at indicated times after NANO-ASODNs were injected through the tail vein. A: Free ASODNs did not concentrate within the liver and these ASODNs disappeared quickly; B: NANO-ASODNs were found to mainly target the liver (the arrow represents the NANO-ASODNs).
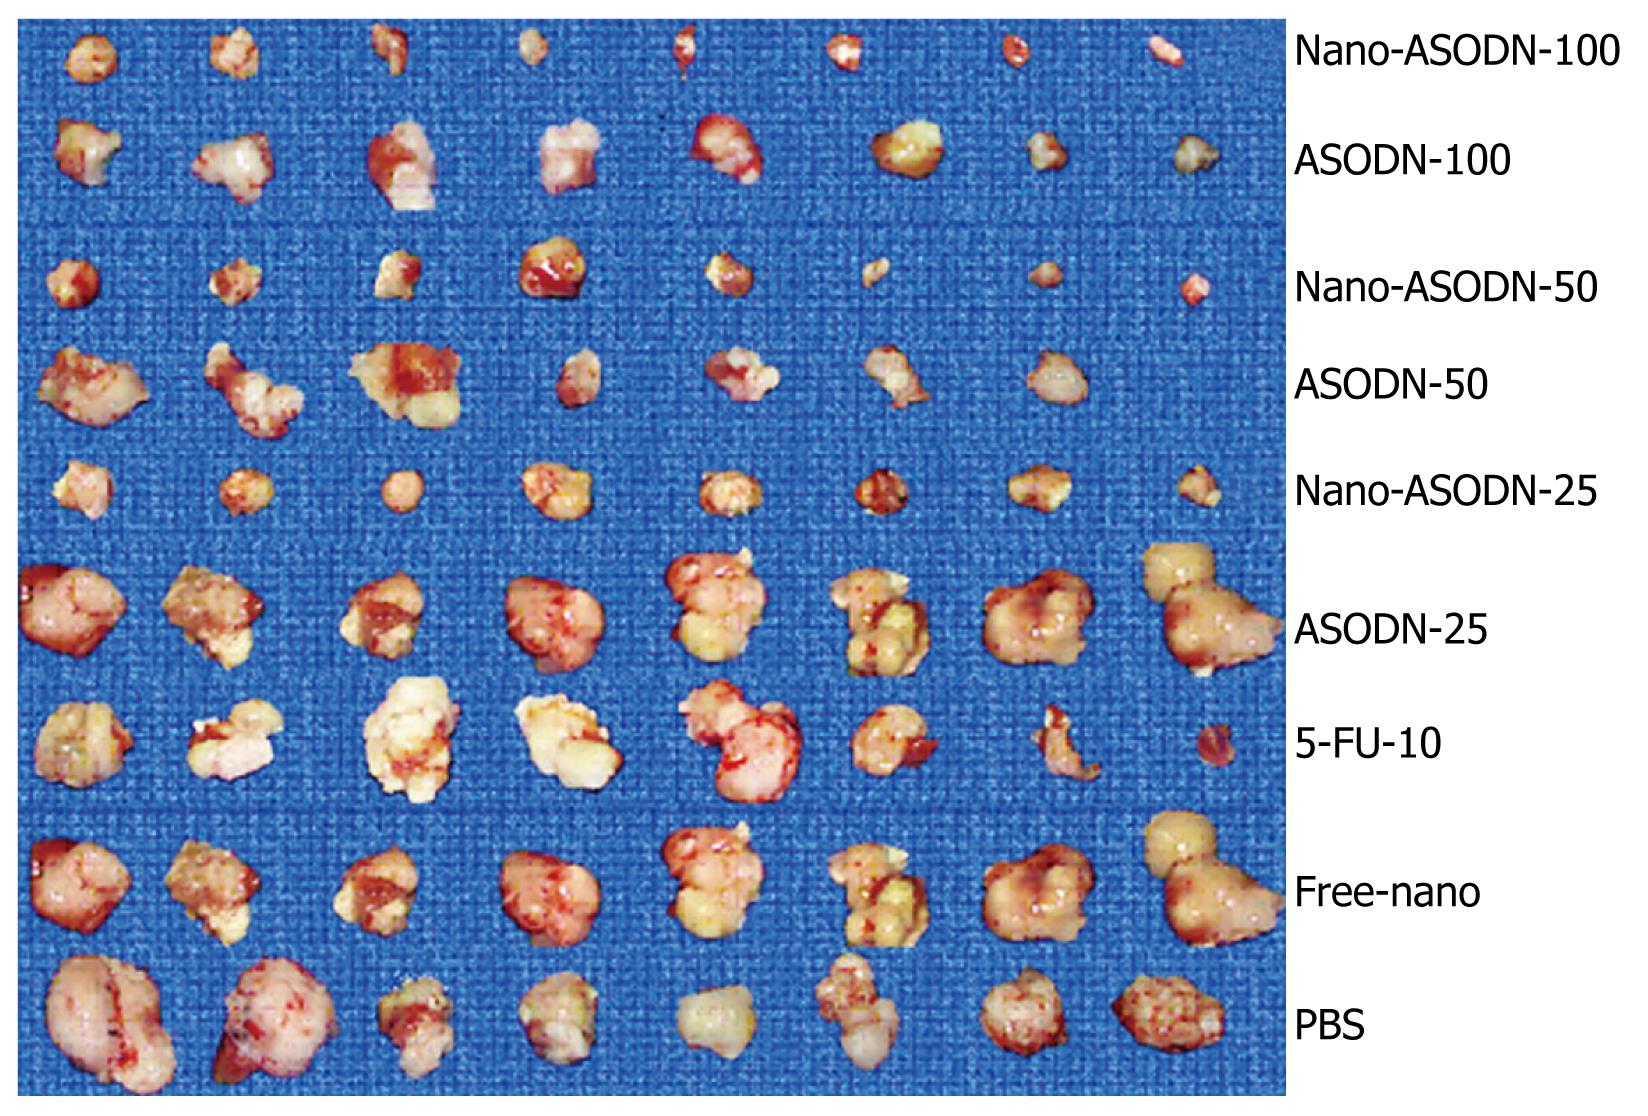
Figure 4 Morphological changes of HCC following treatment with NANO-ASODNs.
The volume of HCC decreased significantly following treatment with 100, 50 and 25 mg/kg per day of NANO-ASODNs for 20 d. MK-ASODNs were the positive control. The PBS or free nanoparticles represent the negative controls.
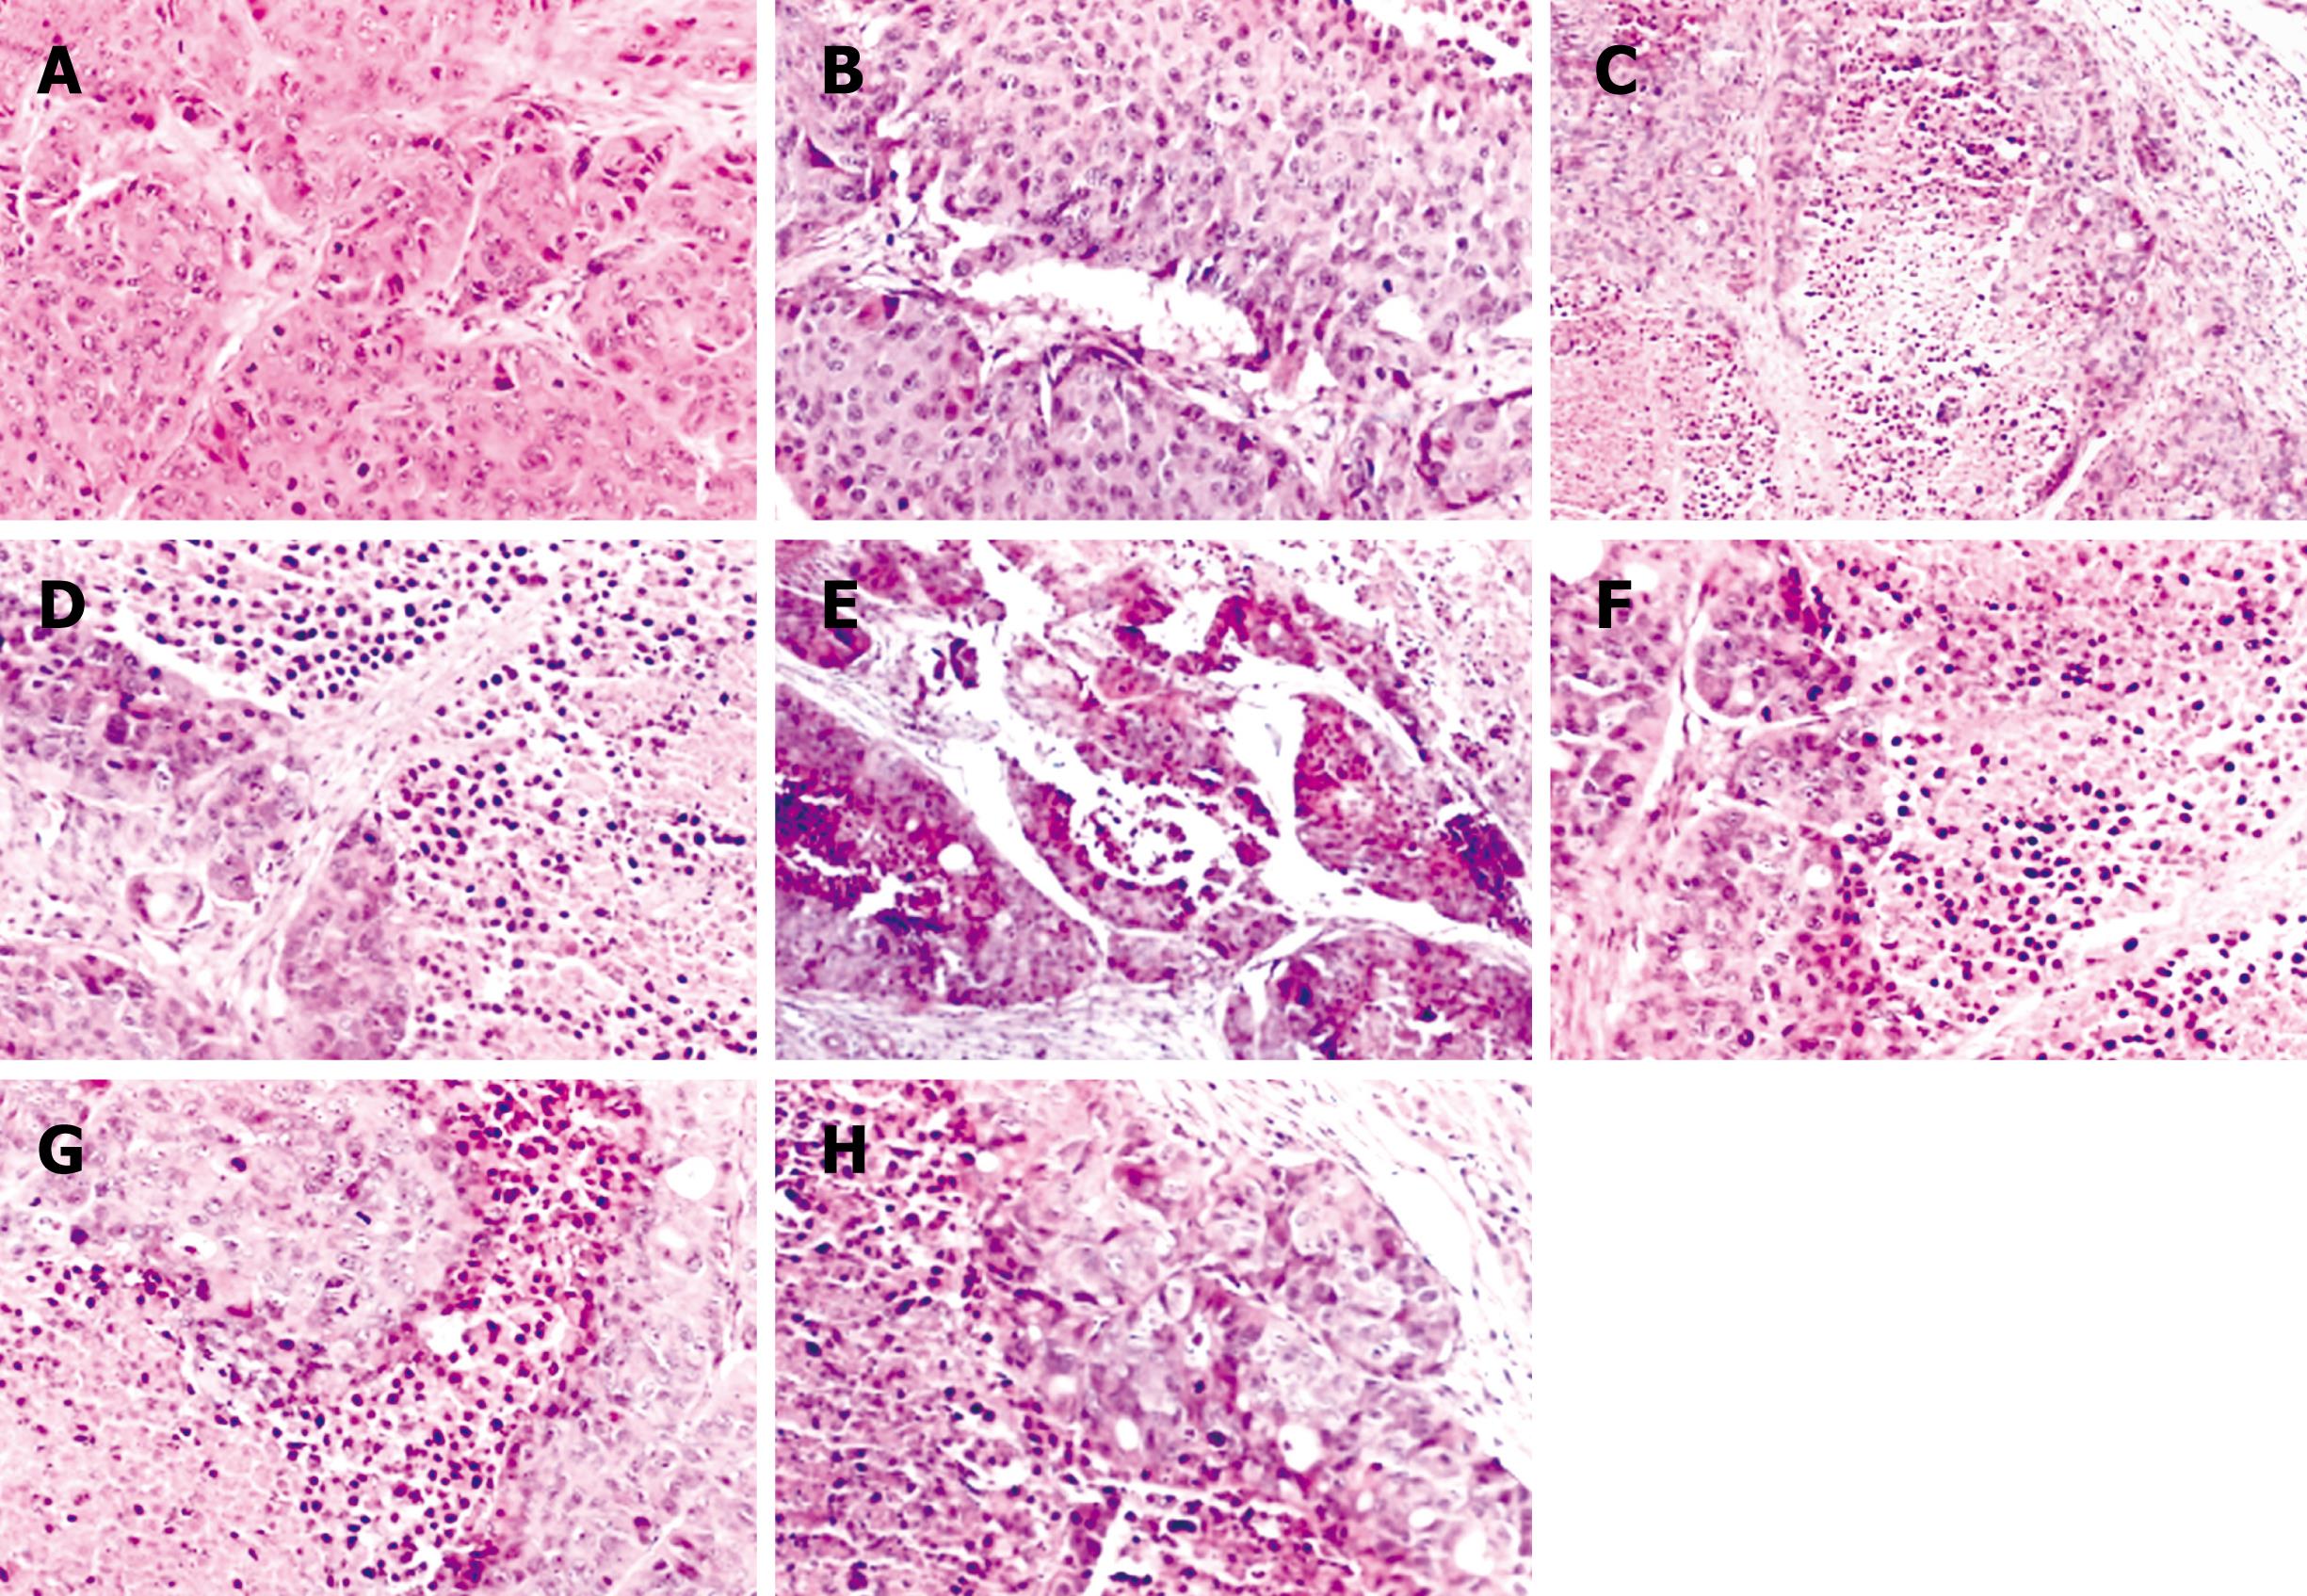
Figure 5 Histopathological analysis.
A: Tissue sections of the tumors from in situ xenograft HCC; B: Tissue sections of the tumors from nanoparticles; C: Tissue sections of the tumors from 5-FU (10 mg/kg per day); D: Tissue sections of the tumors treated with ASODNs 50 mg/kg per day; E-G: Tissue sections of tumors treated with NANO-ASODNs 100, 50 and 25 mg/kg per day of NANO-ASODN treated tumors, respectively; H: Tissue sections of the tumors treated with 5-FU (10 mg/kg per day) and 50 mg/kg per day of NANO-ASODNs. Regions showing an increase of necrosis and fibrosis were observed in the 5-FU or ASODN treatment groups (C-H, × 200) compared with the free nanoparticles and untreated groups (A and B, × 200).
-
Citation: Dai LC, Yao X, Wang X, Niu SQ, Zhou LF, Fu FF, Yang SX, Ping JL.
In vitro andin vivo suppression of hepatocellular carcinoma growth by midkine-antisense oligonucleotide-loaded nanoparticles. World J Gastroenterol 2009; 15(16): 1966-1972 - URL: https://www.wjgnet.com/1007-9327/full/v15/i16/1966.htm
- DOI: https://dx.doi.org/10.3748/wjg.15.1966


