Copyright
©2008 The WJG Press and Baishideng.
World J Gastroenterol. Sep 28, 2008; 14(36): 5570-5583
Published online Sep 28, 2008. doi: 10.3748/wjg.14.5570
Published online Sep 28, 2008. doi: 10.3748/wjg.14.5570
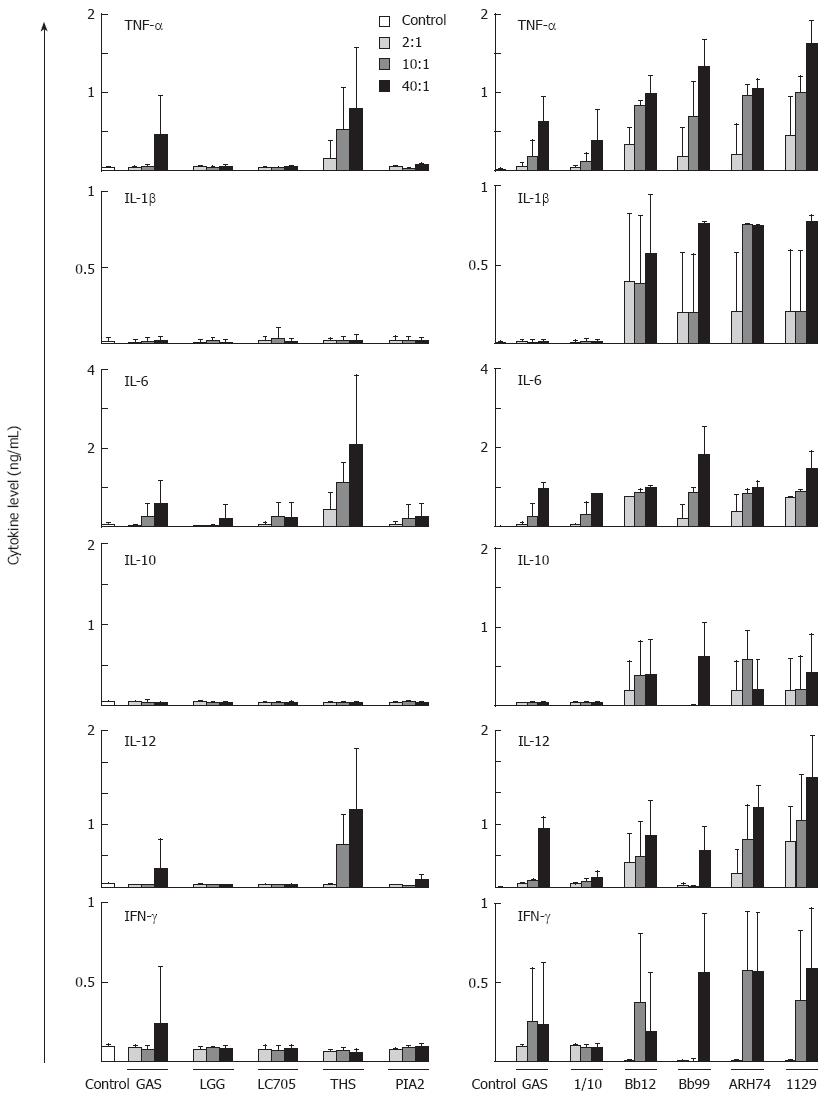
Figure 1 Probiotic bacteria induce cytokine production in human moDCs in a dose-dependent manner.
MoDCs were stimulated with bacteria:host cell ratio of 2:1, 10:1, or 40:1. At 24 h after stimulation cell culture supernatants were collected and cytokine levels were determined by ELISA. The experiment was carried out with cells obtained from four different blood donors, and the columns represent means and error bars indicate the standard deviations. The data is from a representative experiment out of two. GAS: S. pyogenes; LGG: L. rhamnosus GG; LC705: L. rhamnosus LC705; THS: S. thermophilus THS; PIA2: L. mesenteroides subsp. cremoris PIA2; 1/10: B. longum 1/10; Bb12: B. animalis subsp. lactis Bb12; Bb99: B. breve Bb99; ARH74: L. lactis subsp. cremoris ARH74; 1129: L. helveticus 1129.
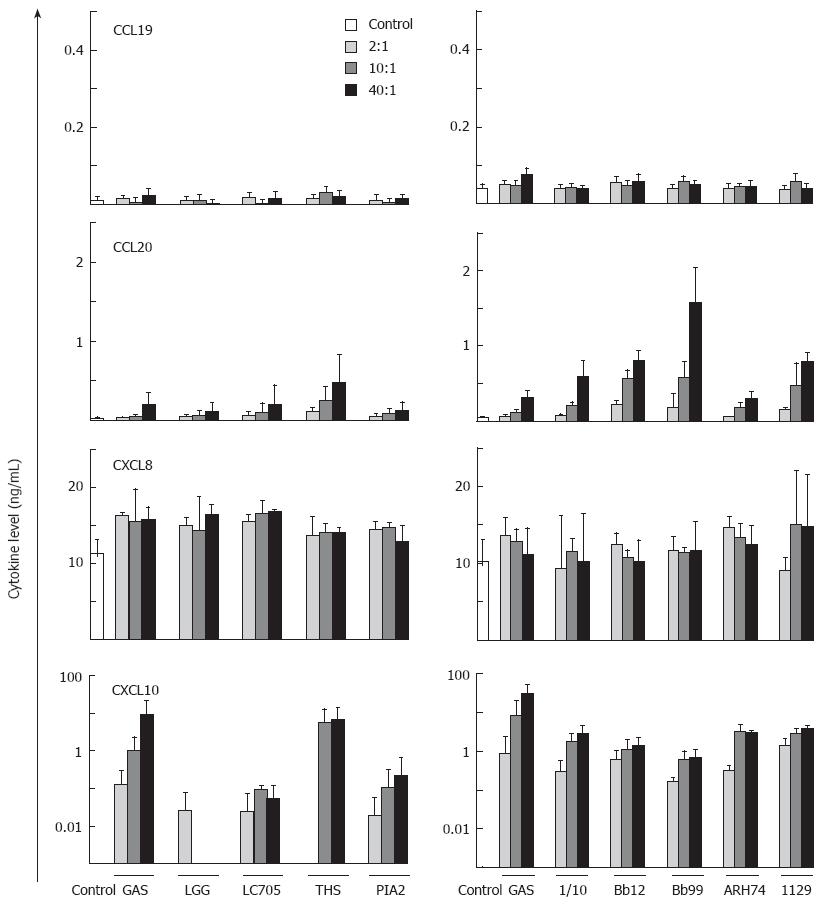
Figure 2 Probiotic bacteria induce chemokine production in moDCs.
MoDCs were stimulated with bacteria:host cell ratio of 2:1, 10:1, or 40:1. Cell culture supernatants from four blood donors were collected at 24 h after bacterial stimulation and the chemokine levels were determined by ELISA. The data is shown as means and error bars indicate standard deviations. Note the differences in scales. The data is from a representative experiment out of two.
Figure 3 The effect of bacterial dose on the maturation of moDCs.
MoDCs were stimulated with bacteria:host cell ratio of 2:1, 10:1, or 40:1. Cells from four different donors were collected, pooled, and stained with antibodies against (A) HLA class II and (B) CD86. The expression of co-stimulatory molecules was analyzed by flow cytometry. The values represent mean fluorescence intensities (MFIs). Results from a representative experiment out of two are shown. Dotted lines indicate respective isotype controls. The staining profiles of HLA class II/CD86 double-positive (percentages included in the profiles) cells (C). GAS: S. pyogenes; THS: S. thermophilus THS; Bb99: B. breve Bb99; ARH74: L. lactis subsp. cremoris ARH74.
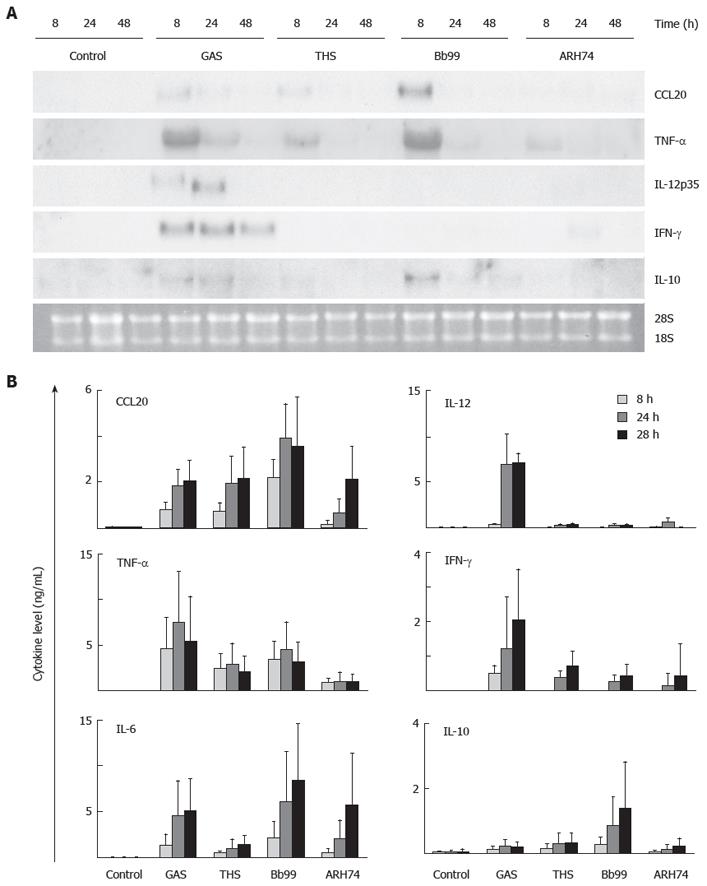
Figure 4 Kinetics of probiotic bacteria induced cytokine gene expression in human moDCs.
MoDCs were stimulated with GAS and indicated probiotic bacteria with a bacteria:host cell ratio of 40:1. A: Cells were collected at 8, 24, and 48 h after stimulation and total cellular RNA was isolated. mRNA expression was analyzed with Northern blotting using CCL20, TNF-α, IL-12p35, IFN-γ, and IL-10 cDNA probes. Ethidium bromide staining was used to control equal sample loading and the integrity of RNA; B: Cell culture supernatants from the experiment described in panel A were collected and cytokine levels in the supernatants were determined by ELISA. The bars and error bars represent the means and standard deviations from four different blood donors. One representative experiment out of two is shown. See Figure 3 for abbreviations of bacteria.
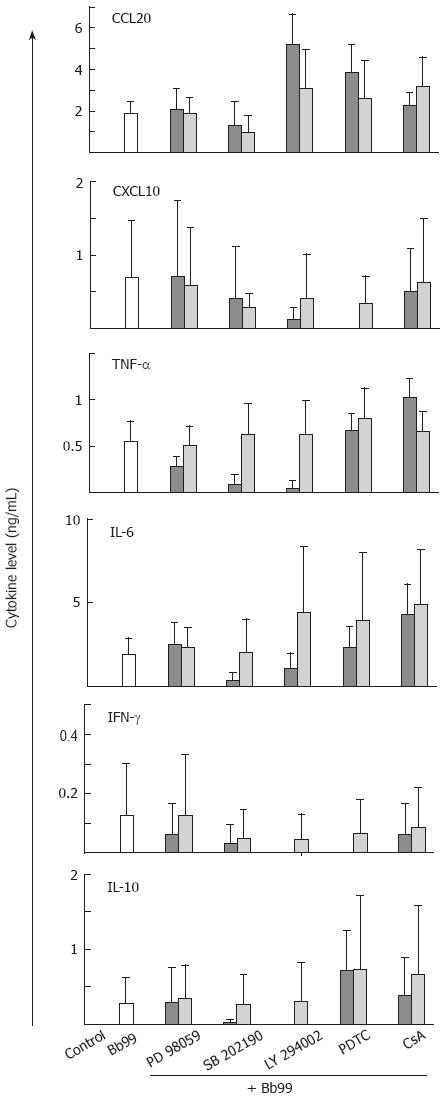
Figure 5 Pharmacological signaling inhibitors interfere with Bifidobacterium breve Bb99 induced cytokine production in moDCs.
moDCs were left untreated or treated with different pharmacological inhibitors for 30 min prior to stimulation with Bb99 (bacteria:host cell ratio of 40:1). Cell culture supernatants from four blood donors were collected at 24 h after stimulation, and cytokine levels were determined by ELISA. The used inhibitors were: p38 MAP kinase inhibitor SB202190, PI3-kinase inhibitor LY294002, ERK MAP kinase inhibitor PD98059, NF-κB inhibitor pyrrolidine dithiocarbamate (PDTC), and NFAT inhibitor cyclosporinA (CsA). Inhibitor concentrations decrease from left to right.
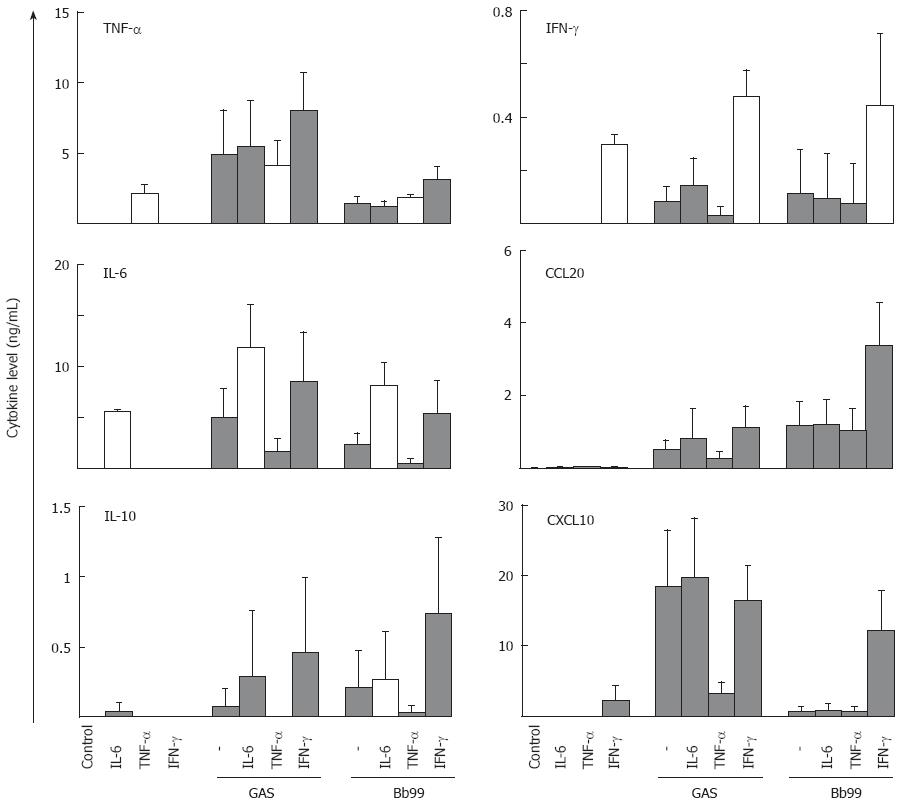
Figure 6 Pre-treatment of human moDCs with proinflammatory cytokines affects bacteria induced cytokine production.
MoDCs were primed with IL-6, TNF-α, or IFN-γ for 16 h. Unprimed or cytokine primed cells were stimulated with GAS or Bb99 (bacteria:host cell ratio of 40:1). Cell culture supernatants were collected at 24 h after stimulation, and cytokine levels in supernatants were determined by ELISA. The experiment was done with cells obtained from four blood donors, and results of a representative experiment out of two are shown. The data is shown as the means, and the error bars represent standard deviations. White bars indicate cytokine priming. GAS; Streptococcus pyogenes; Bb99: Bifidobacterium breve Bb99.
- Citation: Latvala S, Pietilä TE, Veckman V, Kekkonen RA, Tynkkynen S, Korpela R, Julkunen I. Potentially probiotic bacteria induce efficient maturation but differential cytokine production in human monocyte-derived dendritic cells. World J Gastroenterol 2008; 14(36): 5570-5583
- URL: https://www.wjgnet.com/1007-9327/full/v14/i36/5570.htm
- DOI: https://dx.doi.org/10.3748/wjg.14.5570


