Copyright
©2007 Baishideng Publishing Group Co.
World J Gastroenterol. Feb 14, 2007; 13(6): 851-857
Published online Feb 14, 2007. doi: 10.3748/wjg.v13.i6.851
Published online Feb 14, 2007. doi: 10.3748/wjg.v13.i6.851
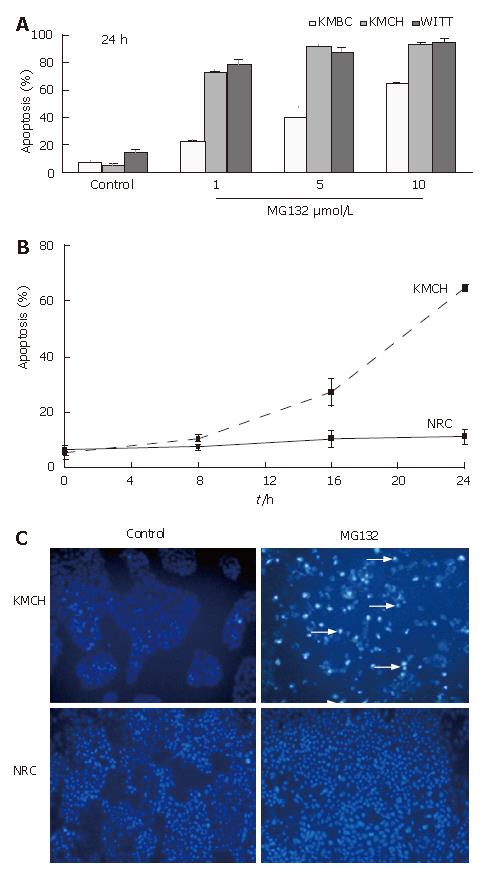
Figure 1 Morphologic assessment of MG132 induced death in KMCH, KMBC and Mz-ChA-1 cholangiocarcinoma and normal rat cholangiocytes (NRC) cell lines.
A: MG132 induces apoptosis in all cholangiocarcionoma cell lines was maximal (> 90%) with a MG132 concentration of 10 (μmol/L); B: MG132 (1 μmol/L) induced apoptosis in the human KMCH cholangiocarcinoma cell line, but not in the nontransformed NRC cells; C: Apoptosis had the classic nuclear appearance as assessed by DAPI staining and fluorescence microscopy.
Figure 2 Caspase 3/7 activity and apoptosis in MG132 and staurosporine (SP) treated KMCH cells A: Cells were treated with MG132 1 μmol/L and SP 5 μmol/L for 16 h.
Caspase 3/7 activity was increased SP cells (P < 0.05). In contrast, caspase activity was not different for MG132 treated cells vs controls. B: Cell death was assessed by morphologic criteria using DAPI and fluorescence microscopy. Cells were treated with SP or MG1321 for 24 h in the absence or presence of the pancaspase inhibitor, QVD at 5 μmol/L. Note QVD blocked staurosporine, but not MG132, induced apoptosis. Data represent the mean ± SE of three separate studies.
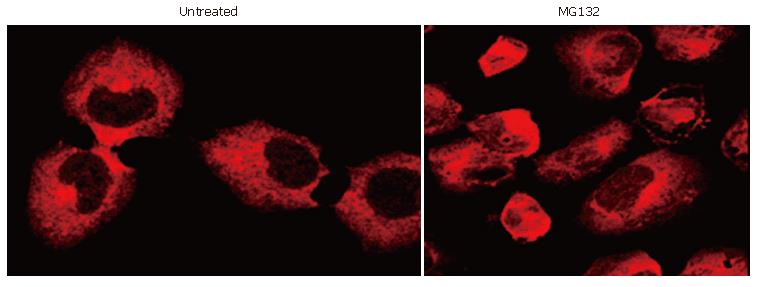
Figure 3 Immunofluorescence for cell localization of the p65 NF-κB subunit.
Cellular compartmentation of the p65 NF-κB subunit was examined in KMCH cells by confocal laser scanning microscopy. The p65 NFκB subunit was completely cytoplasmic in untreated KMCH cholangiocarcinoma cells; its localization also remained cytoplasmic following exposure to MG132 (1 μmol/L) for 24 h.
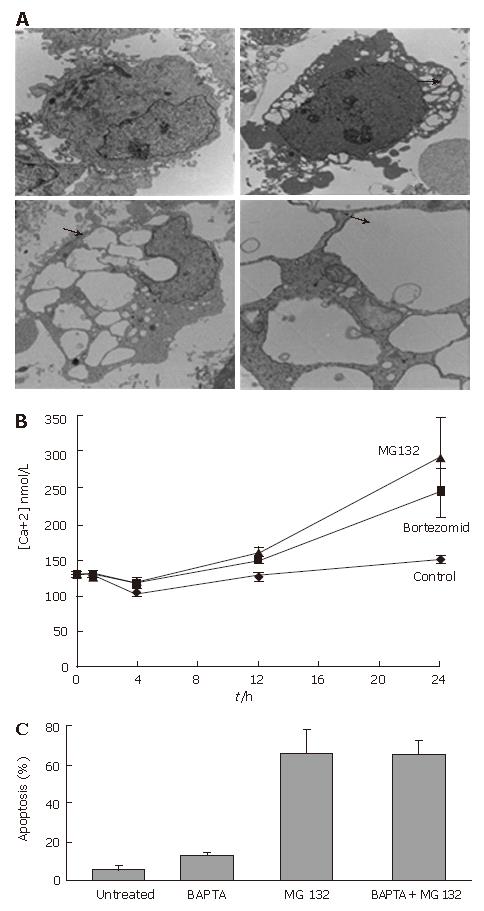
Figure 4 A: Morphologic features of apoptosis induced by proteasome inhibitors, MG132 and bortezomib in KMCH cells.
On the left up panel, transmission electron microscopic appearance of untreated cholangiocarcinoma cell is depicted (bar = 0.5 μm). In the right up panel, exposure to MG132 (1 μmol/L ) for 24 h results in a distinctly dilated ER (arrowhead) (bar = 2 μm) . On the bottom-left panel, similar results are observed with MG 132 (0.5 μmol/L) for 24 h (arrowhead) (bar = 2 μm). Note apoptotic morphology also characterized by condensation of heterochromatin; On the bottom-right panel, high magnification image of cytoplasm shows dilated ER (arrowhead) (bar = 2 μm); B: Cai++ increases following treatment with proteasome inhibitors in KMCH cells. The time course of Cai++ changes is demonstrated. At 24 h, Cai++ levels were significantly increased in MG132 1 mol/L and Bortezomib 1 μmol/L treated cells than untreated KMCH cells (P < 0.05); C: Intracellular Cai++ chelation with BAPTA does not prevent apoptosis by MG132.
Figure 5 The translational inhibitor cycloheximide inhibits MG132 induced cell death in KMCH cells.
The translational inhibitor, cycloheximide (CHM) 50 μmol/L, completely inhibited MG132 1 μmol/L induced apoptosis in KMCH cells co-treated with both agents for 24 h. Cell death was assessed by morphologic criteria using DAPI and fluorescence microscopy. Data represent the mean ± SE of three separate studies.
- Citation: Ustundag Y, Bronk SF, Gores GJ. Proteasome inhibition-induces endoplasmic reticulum dysfunction and cell death of human cholangiocarcinoma cells. World J Gastroenterol 2007; 13(6): 851-857
- URL: https://www.wjgnet.com/1007-9327/full/v13/i6/851.htm
- DOI: https://dx.doi.org/10.3748/wjg.v13.i6.851


