Copyright
©2006 Baishideng Publishing Group Co.
World J Gastroenterol. Sep 21, 2006; 12(35): 5611-5621
Published online Sep 21, 2006. doi: 10.3748/wjg.v12.i35.5611
Published online Sep 21, 2006. doi: 10.3748/wjg.v12.i35.5611
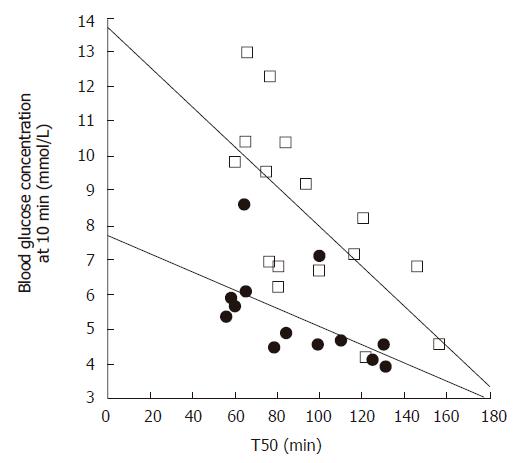
Figure 1 Relationship between the blood glucose concentration 10 min after consuming 75 g glucose in 300 mL water, and the gastric half-emptying time (T50) in patients with type 2 diabetes (open squares, r = -0.
67, P < 0.005) and healthy subjects (filled circles, r = -0.56, P < 0.05). Adapted from Jones et al 1996[28].
Figure 2 Effects of erythromycin (200 mg iv, filled circles) and morphine (8 mg iv, open squares) compared to placebo (open triangles) on (A) solid and (B) liquid gastric emptying and (C) blood glucose concentration in 9 patients with type 2 diabetes.
aP < 0.05, bP < 0.01 vs placebo. Adapted from Gonlachanvit et al 2003[29].
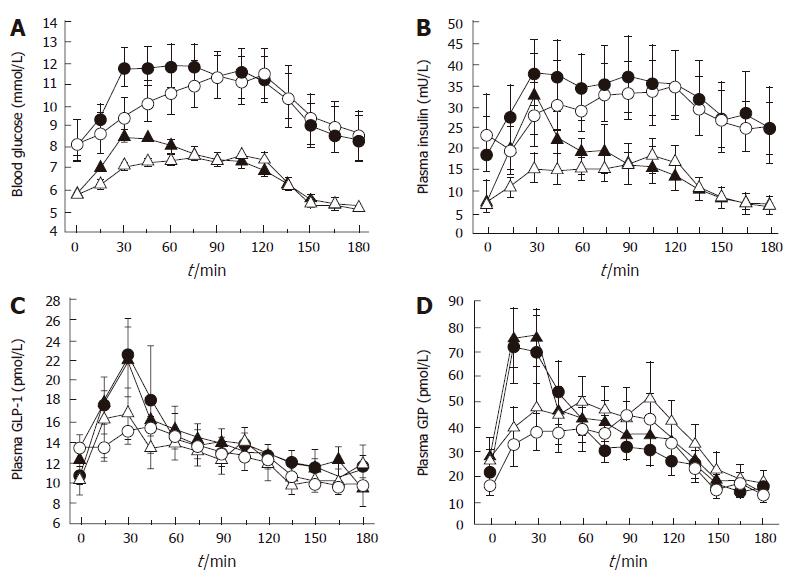
Figure 3 Effect of initially more rapid intraduodenal glucose infusion (3 kcal/min between t = 0 and 15 min and 0.
71 kcal/min between t = 15 and 120 min) (closed symbols) compared to constant infusion (1 kcal/min between t = 0 and 120 min) (open symbols) in healthy subjects (triangles) and patients with type 2 diabetes (circles) on (A) blood glucose, (B) plasma insulin, (C) plasma GLP-1, and (D) plasma GIP. Each pair of curves differs between 0 and 30 min for variable vs constant intraduodenal infusion (P < 0.05). Adapted from O’Donovan et al 2004[52].
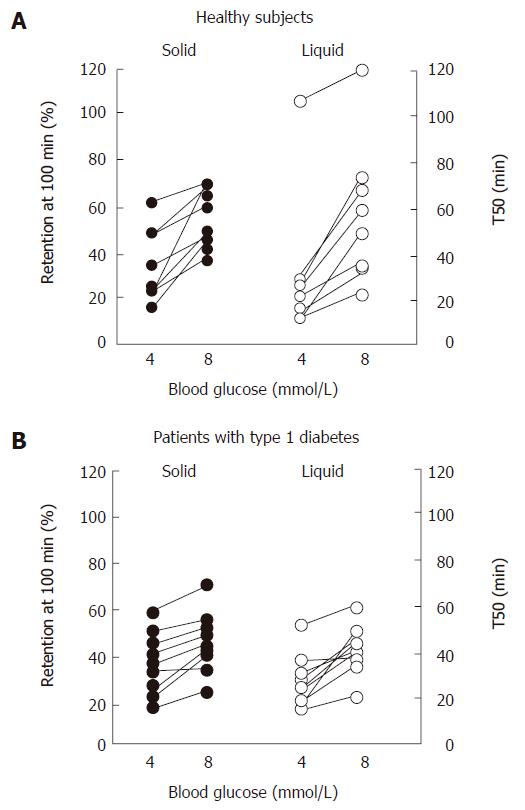
Figure 4 Solid and liquid gastric emptying in (A) healthy subjects and (B) patients with type 1 diabetes mellitus during euglycemia (blood glucose 4 mmol/L) and “physiological” hyperglycemia (blood glucose 8 mmol/L).
Adapted from Schvarcz et al 1997[82].
- Citation: Chaikomin R, Rayner CK, Jones KL, Horowitz M. Upper gastrointestinal function and glycemic control in diabetes mellitus. World J Gastroenterol 2006; 12(35): 5611-5621
- URL: https://www.wjgnet.com/1007-9327/full/v12/i35/5611.htm
- DOI: https://dx.doi.org/10.3748/wjg.v12.i35.5611


