Copyright
©2006 Baishideng Publishing Group Co.
World J Gastroenterol. Aug 14, 2006; 12(30): 4836-4842
Published online Aug 14, 2006. doi: 10.3748/wjg.v12.i30.4836
Published online Aug 14, 2006. doi: 10.3748/wjg.v12.i30.4836
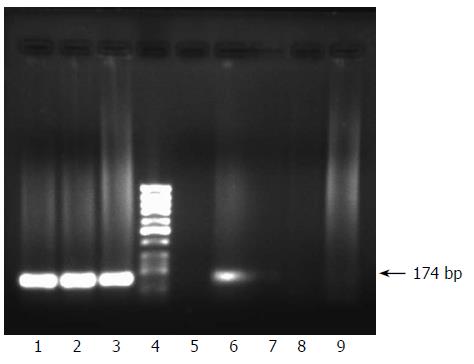
Figure 1 Establishment of an in vitro infection experiment of HepG2 cells with serum of a HCV genotype 4-infected patient and monitoring success of infection by nested RT-PCR amplification of viral sense and minus strands.
The patient was confirmed to be infected with HCV as demonstrated by nested RT-PCR amplification of viral positive strand in the serum (lane 1), and both viral positive and negative strands (lane 2 and lane 3 respectively) in the peripheral blood mononuclear cells. After infection of the cells with the patient sera (see the detailed method in the materials and methods), cells were carefully washed and nested RT-PCR was carried out on the last wash to make sure that the culture medium contained no more viral RNA and results showed no amplified products (lane 5). At this stage we were sure that any detection of viral RNA within the cells could reflect successful viral adsorption and penetration. Three days after infection, RNA was extracted from both cells and their supernatant and nested RT-PCR for detection of both viral strands was carried out and results showed the presence of the sense strand in the cells (lane 6) but not in the supernatant (lane 7). The antisense strand was neither present in the cells nor in the supernatant (lanes 8, 9). Lane 4 is molecular weight standard DNA marker (Ǿ-X-174/HaeIII; Q-BIOgene, Germany).
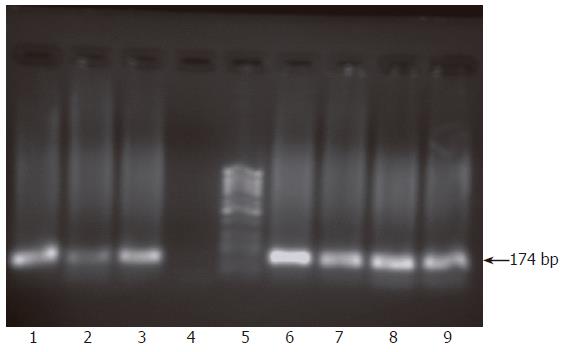
Figure 2 Monitoring of active viral replication at regular time intervals post infection of HepG2 cells.
RNA was extracted from infected cells and infectious supernatants and their passages at 1, 2 and 4 wk post infection and nested RT-PCR was carried out for detection of both viral strands. Results showed the presence of both viral strands in RNA extracted from cells 1 wk post infection (lanes 1, 2) but only the sense strand was detectable in the supernatant at this time point (lane 3) while the antisense strand was absent (lane 4). At 2 and 4 wk post infection, both viral strands were detectable in both cells and supernatant. Lanes 6-9 show the presence of both sense and antisense strands in both cells and supernatant at 4 wk post infection. Lane 5 shows molecular weight standard DNA marker (Ǿ-X-174/HaeIII; Q-BIOgene, Germany).
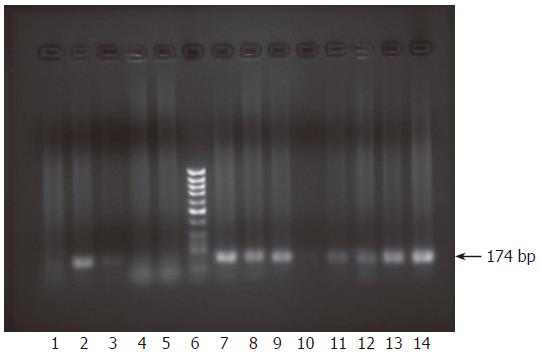
Figure 3 Monitoring infection of HepG2 cells using culture medium from primary infected cells by nested RT-PCR.
After incubation of HepG2 cells with infectious medium presumably containing exocytosed virions from primary infected cells, cells were carefully washed to get rid of any viral traces and the last wash was subjected to RNA extraction followed by nested RT-PCR. Results showed no amplification of positive strand products (lane 1). RNA was extracted from infected cells and supernatants at 3 d, 1, 2 and 4 wk post co-incubation with the infectious supernatant and subjected to nested RT-PCR to check for the presence of each viral strand. At 3 d the cells contained only the positive viral strand (lane 2) but the negative strand was undetectable (lane 3). However, the supernatants contained none of the strands, only primers used could be seen (lanes 4, 5). Lane 6 is molecular weight standard DNA marker (Ǿ-X-174/HaeIII; Q-BIOgene, Germany). At 1 wk post infection, both sense and antisense strands were detectable in the RNA extracted from the infected cells (lanes 7, 8), whereas the supernatant contained only the sense strand (lane 9) but not the antisense strand (lane 10). At 2 and 4 wk, RNA extracted from infected cells as well as the supernatants contained both positive and negative strands. Results of amplification for both positive and negative strands for cellular RNA are shown (2 wk, lanes 11, 12) and (4 wk, lanes 13, 14).
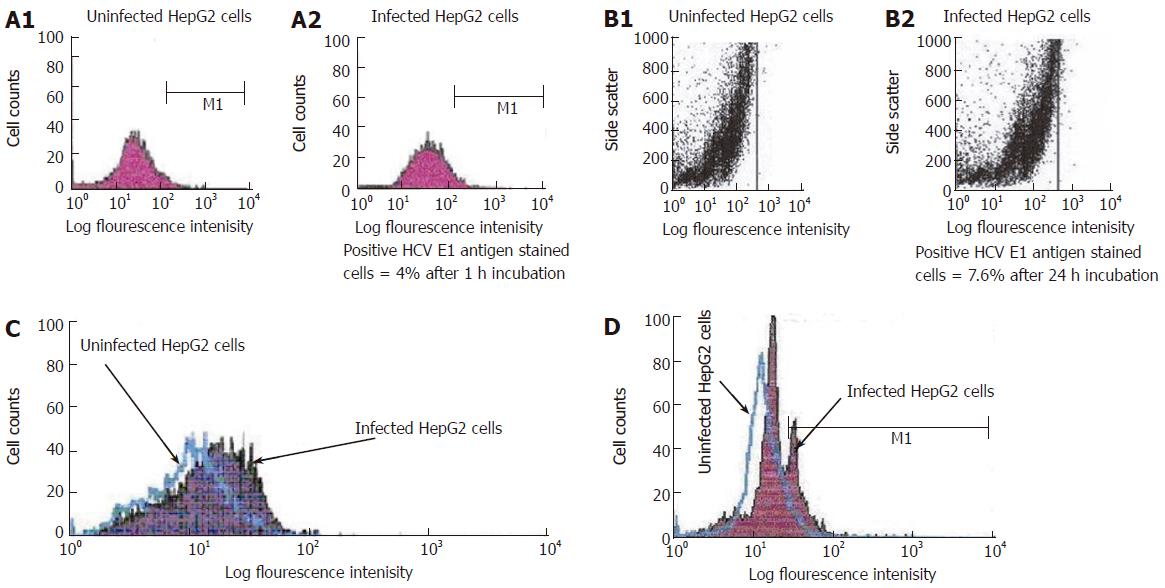
Figure 4 A: Single parameter histogram for flow cytometric analysis of surface staining of HCV E1 gene expression on the infected HepG2 cells after one hour incubation.
HepG2 cells were incubated with PBS (A1) (uninfected) or with HCV positive serum (A2) (infected) for 1 h incubation. Cells were harvested and stained with FITIC labeled HCV anti-E1 antibody as described in materials and methods; B: Dot histogram for flow cytometric analysis of surface staining of HCV E1 gene expression on the infected HepG2 cells after 24 h incubation. HepG2 cells were incubated with PBS (B1) (uninfected) or with HCV positive serum (B2) (infected) for 24 h incubation. Cells were harvested and stained with FITIC labeled HCV anti-E1 antibody; C: Overlap histogram for flow cytometric analysis of surface staining of HCV E1 gene expression on the infected HepG2 cells after one week incubation. HepG2 cells were incubated with PBS (uninfected) or with HCV positive serum (infected) for one week incubation. Cells were harvested and stained with FITIC labeled HCV anti-E1 antibody; D: Overlap histogram for flow cytometric analysis of intracellular staining of HCV core gene expression in the infected HepG2 cells after 3 d incubation. HepG2 cells were incubated with PBS (uninfected) or with HCV positive serum (infected) for 3 d incubation. Cells were harvested and stained with FITIC labeled HCV anti-core antibody Labeled cells were analyzed with flow cytometry (FACS Calibure, Becton Dickinson).
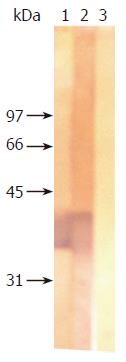
Figure 5 Testing translation of viral E1 in supernatant and lysates of HepG2 cells infected with HCV from 1 mo culture by Western blot analysis.
Supernatant (strip 1) and lysates (strip 2) of HepG2 cells infected with HCV were subjected to Western blot analysis, hybridization with the anti-E1 antibody clearly showed the expression of a cluster of immunogenic proteins at molecular weights localized between 31 and 45 kDa. This cluster was undetectable on the strip immobilized with uninfected HepG2 cell lysates (strip 3).
- Citation: El-Awady MK, Tabll AA, El-Abd YS, Bahgat MM, Shoeb HA, Youssef SS, Din NGBE, Redwan ERM, El-Demellawy M, Omran MH, El-Garf WT, Goueli SA. HepG2 cells support viral replication and gene expression of hepatitis C virus genotype 4 in vitro. World J Gastroenterol 2006; 12(30): 4836-4842
- URL: https://www.wjgnet.com/1007-9327/full/v12/i30/4836.htm
- DOI: https://dx.doi.org/10.3748/wjg.v12.i30.4836


