Copyright
©2006 Baishideng Publishing Group Co.
World J Gastroenterol. Jan 14, 2006; 12(2): 214-221
Published online Jan 14, 2006. doi: 10.3748/wjg.v12.i2.214
Published online Jan 14, 2006. doi: 10.3748/wjg.v12.i2.214
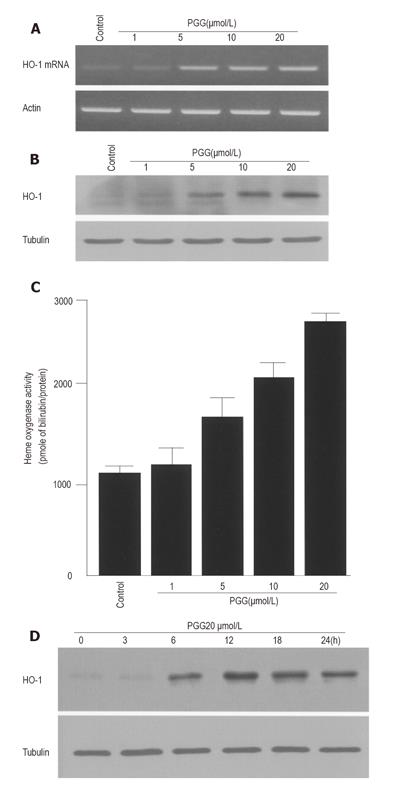
Figure 1 Effects of PGG on HO-1 mRNA and protein expression and HO activity in HepG2 cells.
A, B, C: Cells were incubated with indicated concentrations of PGG for either 4 h (A) or 12 h (B and C); D: Cells were also incubated with 20 µmol/L PGG for indicated times. Data are expressed as mean ± SE of five independent experiments.
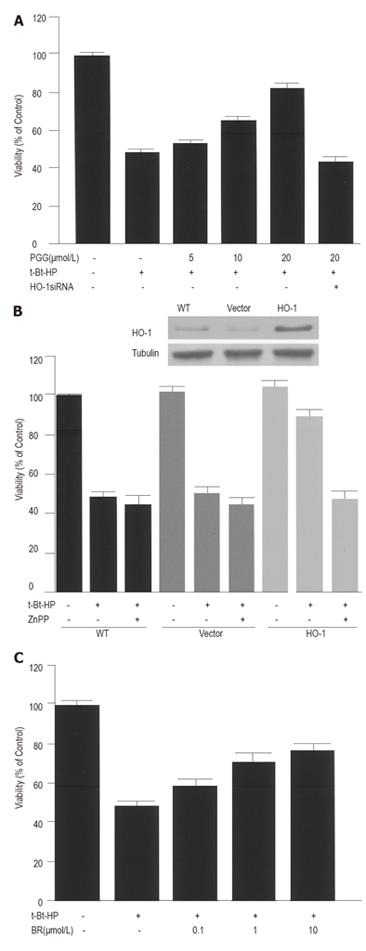
Figure 2 Effects of PGG-induced HO-1 on t-Bt-HP-induced toxicity in HepG2 cells.
A: Cells transiently transfected with HO-1 siRNA were pre-incubated with indicated concentrations of PGG for 12 h, and exposed to 100 µmol/L t-Bt-HP for 4 h; B: Cells (WT) were transiently transfected with control vector (Vector) or HO-1 gene (HO-1), and then exposed to 100 µmol/L t-Bt-HP for 4 h in the absence or presence of 20 µmol/L ZnPP; C: Cells were exposed to 100 µmol/L of t-Bt-HP for 4 h in the absence or presence of indicated concentrations of bilirubin (BR). Data are expressed as mean ± SE of five independent experiments.
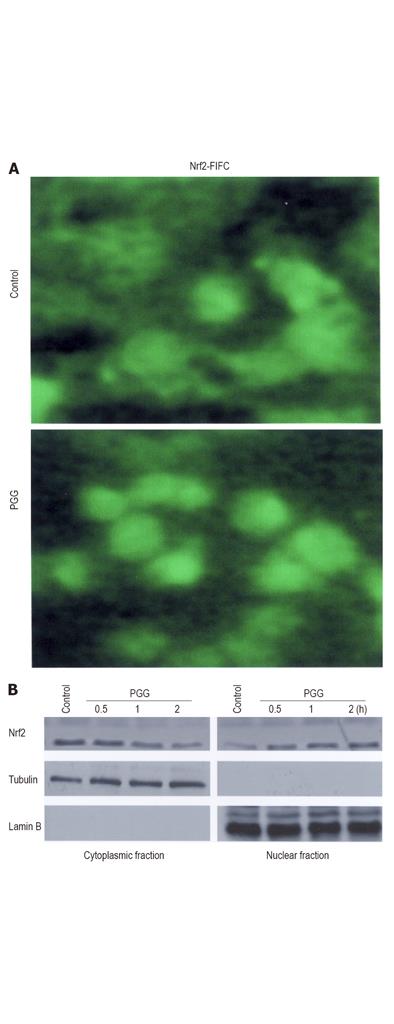
Figure 3 Effects of PGG on Nrf2 nuclear translocation in HepG2 cells.
A: After 2-h treatment with 20 µmol/L PGG; B: Cytoplasmic and nuclear extracts harvested from control cells and cells treated for indicated times with 20 µmol/L PGG, and Western blotting performed with antibodies for Nrf2, tubulin and lamin B.
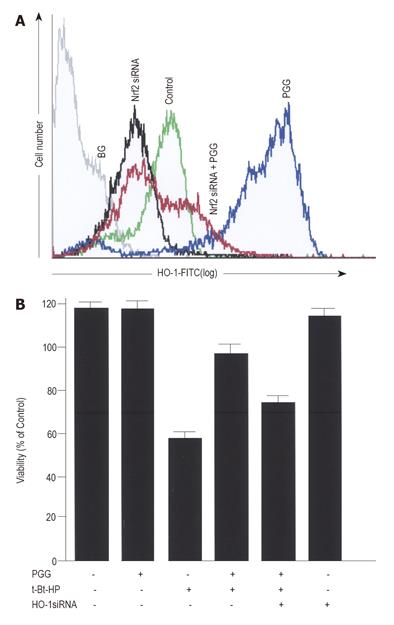
Figure 4 Effects of PGG-induced Nrf2 activation on HO-1 expression and t-Bt-HP-induced toxicity in HepG2 cells.
A: Normal cells and the cells transiently transfected with Nrf2 siRNA were pre-incubated with 20 µmol/L PGG for 12 h. HO-1 expression was determined by a flow cytometry. BG indicates background auto-fluorescence; B: Cells and transfected cells pre-incubated for 12 h with 20 µmol/L PGG were exposed to 100 µmol/L t-Bt-HP for 4 h. Data are expressed as mean ± SE of five independent experiments.
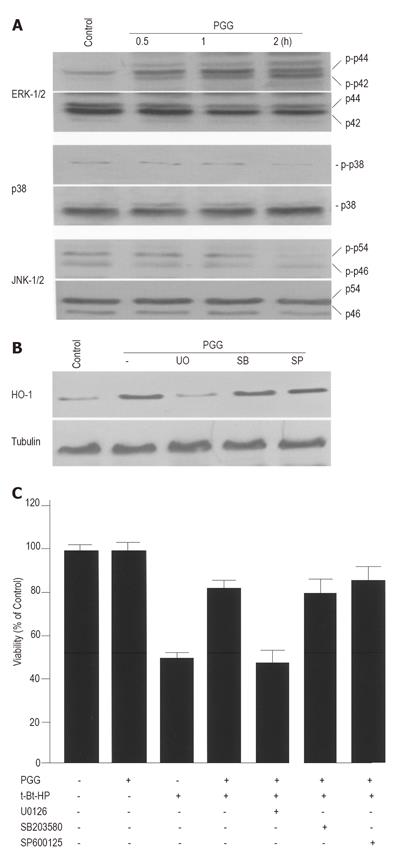
Figure 5 Effects of PGG-induced ERK activation on HO-1 expression and t-Bt-HP-induced toxicity in HepG2 cells.
A: Cells were incubated with 20 µmol/L PGG for indicated times, and Western blotting was performed with specific antibodies; B: Cells were incubated with 20 µmol/L PGG for 12 h in the presence or absence of 10 µmol/L U0123 (UO), 20 µmol/L SB203580 (SB), or 20 µmol/L SP600125 (SP), and Western blotting was performed with HO-1 antibody; C: Cells untreated or treated with PGG in the presence or absence of each specific inhibitor for 12 h were exposed to 100 µmol/L t-Bt-HP for 4 h. Data are expressed as mean ± SE of five independent experiments.
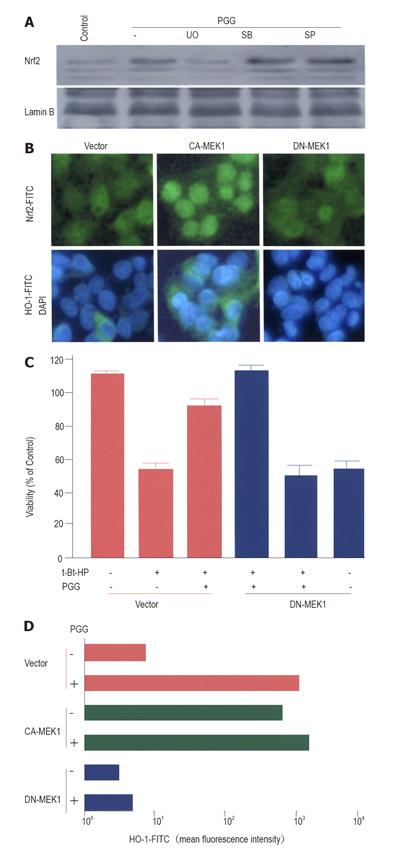
Figure 6 Roles of PGG-induced ERK activation in Nrf2 nuclear translocation and t-Bt-HP-induced toxicity in HepG2 cells.
A: Cells were incubated with 20 µmol/L PGG for 2 h in the presence or absence of 10 µmol/L U0123 (UO), 20 µmol/L SB203580 (SB), or 20 µmol/L SP600125 (SP), and nuclear extracts were harvested, following Western blotting analysis with Nrf2 antibody; B: Cells were transiently transfected with control vector (Vector), CA-MEK1 gene, or DN-MEK1 gene, stained with Nrf2 antibody (upper) or HO-1 antibody and DAPI (lower), and visualized using a fluorescent microscope; C: Cells transfected with control vector or DN-MEK1 gene were pre-incubated with 20 µmol/L PGG for 12 h, and exposed to 100 µmol/L t-Bt-HP for 4 h. Data are expressed as mean ± SE of five independent experiments; D: Cells transfected with vector or each gene were incubated for 12 h in the absence or presence of 20 µmol/L PGG. HO-1 expression was determined by a flow cytometry.
- Citation: Pae HO, Oh GS, Jeong SO, Jeong GS, Lee BS, Choi BM, Lee HS, Chung HT. 1,2,3,4,6-penta-O-galloyl-β-D-glucose up-regulates heme oxygenase-1 expression by stimulating Nrf2 nuclear translocation in an extracellular signal-regulated kinase-dependent manner in HepG2 cells. World J Gastroenterol 2006; 12(2): 214-221
- URL: https://www.wjgnet.com/1007-9327/full/v12/i2/214.htm
- DOI: https://dx.doi.org/10.3748/wjg.v12.i2.214


