Copyright
©The Author(s) 2004.
World J Gastroenterol. Jun 1, 2004; 10(11): 1625-1629
Published online Jun 1, 2004. doi: 10.3748/wjg.v10.i11.1625
Published online Jun 1, 2004. doi: 10.3748/wjg.v10.i11.1625
Figure 1 Electron microscopic images of hepatocytes.
A: Normal mitochondria in control hepatocytes (TEM × 6700), B: Swollen or cavitated mitochondria in treated hepatocytes (TEM × 5800).
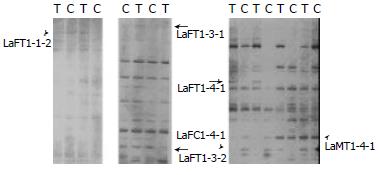
Figure 2 Polyacrylamide-urea gel of DNA fragments.
Six dif-ferentially expressed bands in two pairs of rats were obtained. “T” above the bands and in name represents treated group, while “C” represents control group, “M” represents male, and “F” represents female. Among the bands, the expression levels of LaFT1-1-2, LaFT1-3-1, LaFT1-3-2, LaFT1-4-1 and LaMT1-4-1 were increased in treated rats. However, the level of LaFC1-4-1 was decreased.
Figure 3 Sequences of cDNA.
A: Sequence of LaFT1-4-1. Its length was about 160 bp. The primers used were AP1 and ARP4. B: Sequence of LaMT1-4-1. Its length was about 144 bp. The primers used were AP1 and ARP4.
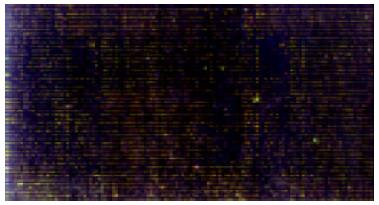
Figure 4 Two overlying fluorescent signals.
- Citation: Zhao H, Hao WD, Xu HE, Shang LQ, Lu YY. Gene expression profiles of hepatocytes treated with La (NO3) 3 of rare earth in rats. World J Gastroenterol 2004; 10(11): 1625-1629
- URL: https://www.wjgnet.com/1007-9327/full/v10/i11/1625.htm
- DOI: https://dx.doi.org/10.3748/wjg.v10.i11.1625


