Copyright
©The Author(s) 2017.
World J Diabetes. Jun 15, 2017; 8(6): 249-269
Published online Jun 15, 2017. doi: 10.4239/wjd.v8.i6.249
Published online Jun 15, 2017. doi: 10.4239/wjd.v8.i6.249
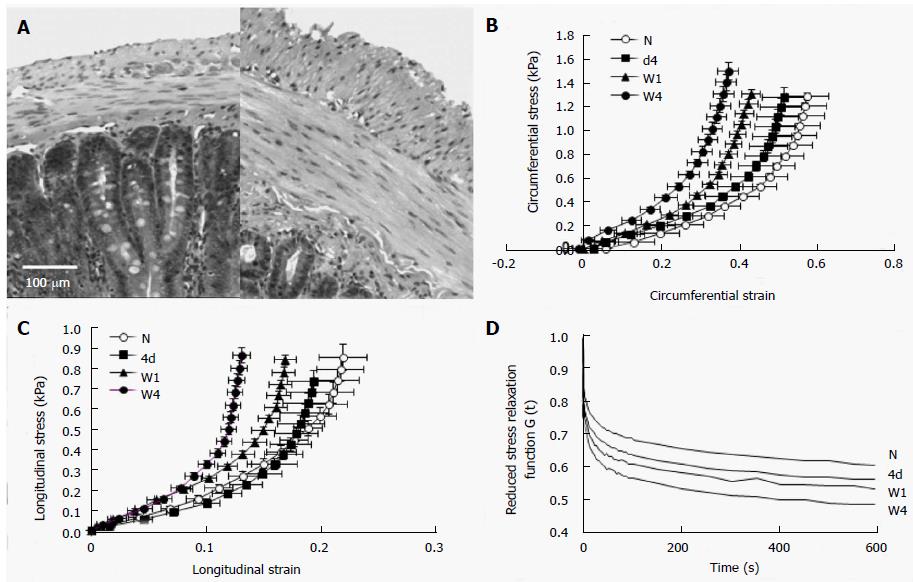
Figure 1 Duodenal remodeling in STZ-induced diabetic rats.
A: The micro-photographs showed the normal (left) and 4 wk diabetic (right) duodenal histological sections. It clearly demonstrated that the muscle and submucosa layers in the diabetic duodenum became much thicker than in the normal duodenum. The bar is 100 μm; B: The circumferential stress-strain relations; C: The longitudinal stress-strain relations. The stress-strain curves in both directions (B and C) shifted to the left during experimental diabetes indicating the duodenal wall became stiffer during the development of diabetes; D: The mean reduced relaxation function curves in the time period of 600 s. The curves appear in the order of largest-to-smallest G (t) as W4, W1, 4d and N. The stress relaxation of duodenum decreased with the development of experimental diabetes. N: Normal control; 4d: 4 d of diabetes; W1: 1 wk of diabetes; W4: 4 wk of diabetes; W8: 8 wk of diabetes.
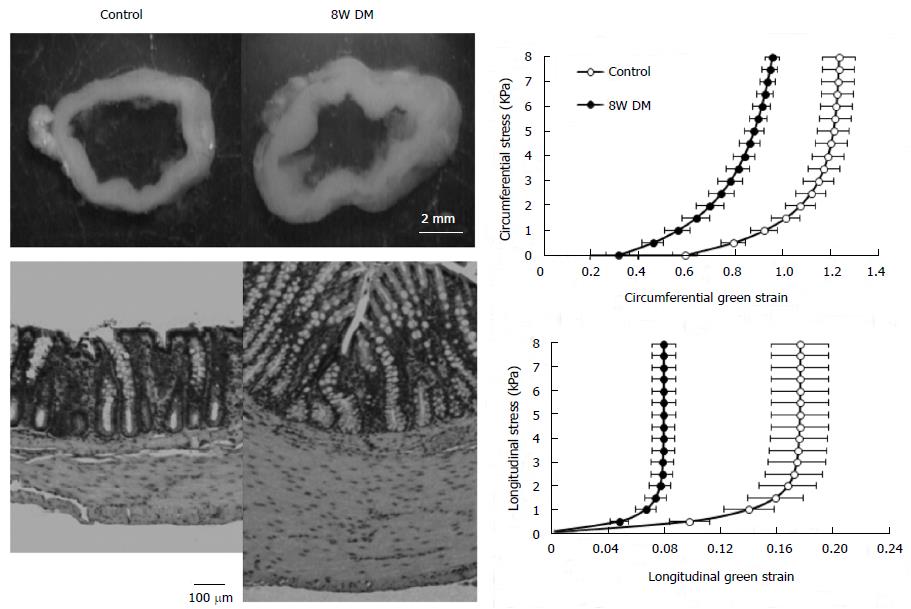
Figure 2 Colonic remodeling in STZ-induced diabetic rats.
The top-left figure showed the no-load tissue rings of colon from control (left) and 8W streptozotocin-induced diabetic rats (right). It clearly demonstrated that the wall thickness increased in the diabetic colon. The low-left figure showed micro-photographs of the control (left) and 8 wk diabetic (right) colonic histological sections. It clearly demonstrated that the mucosa and muscle layers in the diabetic colon became much thicker than in the normal colon. The bar is 100 μm. The right figures showed the relation between circumferential (top) and longitudinal (bottom) stress and strain. Both in the circumferential and the longitudinal directions, the stress-strain curves shifted to the left in the 8W diabetic groups compared to those in the control group. Thus, the colon wall stiffness increased in both directions during the development of diabetes. Control: Normal control; 8W DM: 8 wk of diabetes.
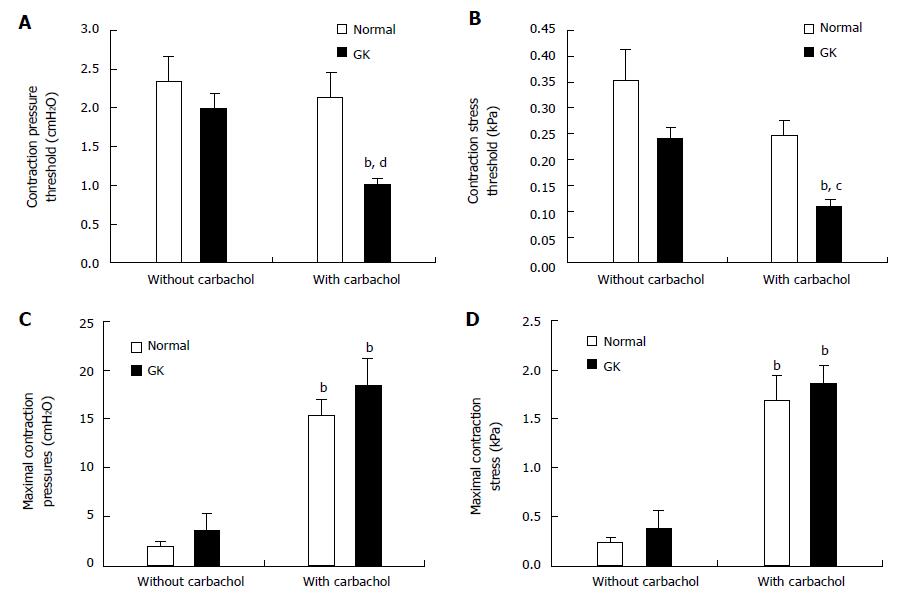
Figure 3 Jejunal contractility in response to flow and ramp distension in type 2 diabetic GK rats after carbachol stimulation.
Top figures showed the pressure (A) and circumferential stress (B) at the contraction threshold during ramp distensions. The pressure and stress thresholds were significantly decreased in GK group but not in Normal group after carbachol application (compared with without carbachol application, bP < 0.01). Furthermore, the pressure and stress thresholds were significantly smaller in the GK group than in Normal group after carbachol stimulation (compared with Normal group, cP < 0.05; dP < 0.01). Middle figures showed the maximum contraction pressure (C) and stress (D) during basic contraction. After carbachol application, the maximum contraction pressure and stress significantly increased both for Normal and GK groups (compared with without carbachol application bP < 0.01). Bottom figures showed the maximum contraction pressure (E) and stress (F) in the flow-induced contraction after carbachol application. Compared to the Normal group, the maximum contraction pressure and stress were significantly bigger at outlet pressure levels of 0 and 2.5 cmH2O in the GK group (cP < 0.05, dP < 0.01).
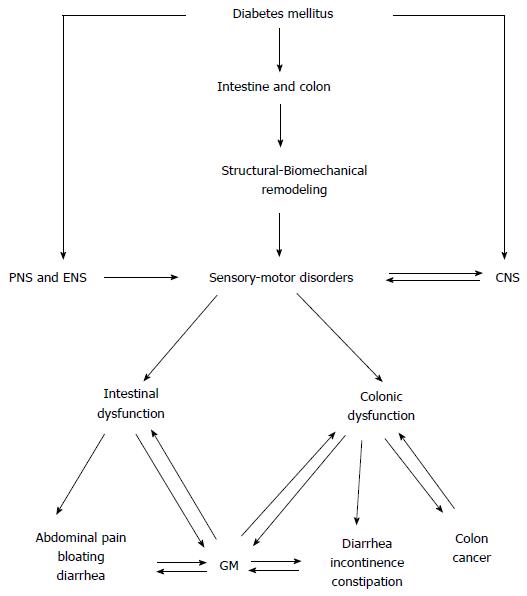
Figure 4 The diagram shows the diabetes mellitus-induced intestinal and colonic changes and clinical consequences.
CNS: Central nerve system; PNS: Peripheral nerve system; ENS: Enteric nervous system; GM: Gut microbiota.
- Citation: Zhao M, Liao D, Zhao J. Diabetes-induced mechanophysiological changes in the small intestine and colon. World J Diabetes 2017; 8(6): 249-269
- URL: https://www.wjgnet.com/1948-9358/full/v8/i6/249.htm
- DOI: https://dx.doi.org/10.4239/wjd.v8.i6.249


